
Page 223 - 2021_07-Haematologica-web
P. 223
Letters to the Editor
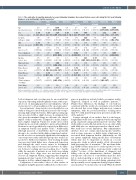
Table 2. The odds ratio of reporting moderate to severe Edmonton Symptoms Assessment System score (≥4) during the first year following diagnosis using multivariable logistic regression.#
Age
(per year increase)
Sex
(femalevs.male) Location
(urban vs. rural) SES
Tiredness Well being
1.01 1.00 (0.99-1.02) (0.99-1.02)
1.36 1.35
Pain Drowsiness
0.98 0.99 (0.98-0.99) (0.99-1.01)
1.28 1.19
Loss
of appetite
1.00 (0.99-1.01)
1.43
Anxiety
0.99 (0.98-1.00)
1.59
Shortness of breath
1.00 (0.99-1.01)
Depression Nausea
0.98 0.98 (0.87-0.99) (0.97-0.99)
0.92 1.32 1.56
(1.11-1.68) (1.12-1.63)(1.09-1.52)(1.02-1.39)(1.22-1.67)(1.35-1.85)
(0.79-1.06)
0.99 (0.79-1.22)
1.15
(0.94-1.40)
1.10 (0.89-1.37)
0.99
(0.97-1.02)
(1.12-1.52) (1.33-1.85) 1.06 1.35
0.85 (0.63-1.15)
1.31
(1.01-1.69)
1.20 (0.88-1.64)
0.98
(0.94-1.01)
1.05 (0.84-1.31)
1.86
(0.98-3.53)
1.23 (0.87-1.73)
1.26
(0.99-1.62)
(0.73-1.39)
0.99 (0.76-1.30)
0.95
(0.74-1.22)
1.09 (0.83-1.44)
0.97
(0.94-1.01)
1.05 (0.86-1.28)
1.10
(0.68-1.78)
1.00 0.96 (0.79-1.27) (0.76-1.20)
0.93 1.10
(0.75-1.16) (0.89-1.36)
1.02 1.20 (0.80-1.29) (0.95-1.51)
0.96 0.99 (0.93-0.99) (0.96-1.02)
1.04 1.29 (0.83-1.32) (1.05-1.61)
0.92 1.18
(0.74-1.14) (0.96-1.45)
1.02 1.02 (0.81-1.29) (0.82-1.28)
0.92 0.97 (0.89-0.95) (0.95-1.00)
(0.85-1.32)
(1.02-1.72)
(poor vs. non-poor) CCI
0.89 1.06
(0.81-1.27)
0.99 0.95
(≥2 vs.≤1) Year of diagnosis
(0.85-1.32) (0.85-1.36)
(0.72-1.09)
1.02 1.07
(per year increase) Anemia
(yes vs. no) Hypercalcemia
(yes vs. no) Bone disease
(yes vs. no) Renal Disease
(yes vs. no) Hospital
(Non-teaching vs. teaching)
Novel drugs
(yes vs. no)
(0.87-1.02)
1.11 0.99
(0.92-0.98)
0.96 1.00 0.95 1.23
(0.81-1.14) (0.84-1.18)
1.64 1.36 (1.06-2.54) (0.90-2.04)
1.19 (0.80-1.13) (1.05-1.45)(1.01-1.40)
(0.95-1.31)
(0.83-1.18)
1.25 1.14
(0.83-1.88) (0.79-1.66) 1.72 1.07
(1.31-2.27) (0.84-1.37) 1.36 1.07
(1.13-1.65) (0.89-1.27) 0.94 1.11
(0.78-1.14) (0.93-1.33)
0.96 0.99
(0.75-1.25) (0.78-1.26)
1.10
(0.76-1.58)
1.022 (0.80-1.30)
1.09
(0.92-1.30)
1.05 (0.88-1.27)
0.88
(0.69-1.11)
1.35 1.18
(0.96-1.56)
1.081 1.07
(0.94-1.96)
1.22 1.12
1.52
(1.10-2.12) (1.92-3.67) (0.99-1.67)
(0.81-1.73) (0.87-1.45)
2.65 1.29 1.31 0.85 1.12
(1.05-1.64) (0.71-1.03) (0.93-1.35) 1.09 1.27 0.93
(0.88-1.35) (1.05-1.54) (0.88-1.11) 1.01 0.96 1.20 0.94
(0.91-1.29)
1.23 1.08
(0.89-1.30)
0.91 (0.72-1.17)
(1.03-1.47)
(0.88-1.30)
0.95 1.12
(0.71-1.30) (0.93-1.55) (0.73-1.20)
(0.75-1.21)
(0.87-1.45)
#Data are presented as odds ratios (95% confidence interval).A higher odds ratio is‘worse’,indicating that the covariate is associated with a higher odds of reporting mod- erate to severe symptom. Bold indicates statistically significant values (P<0.05). SES: socioeconomic status; CCI: Charlson Comorbidity Index.
both at diagnosis and over time may be an essential first step in incorporating multidisciplinary teams, with a spe- cific focus on managing psychosocial symptoms, which are known to be often unaddressed by oncology teams.6
Several patients’ characteristics were identified in our study as being associated with an increased odds of expe- riencing high symptom burden. Although increasing age was associated with a slight decrease in symptom bur- den, given the minimal change in odds ratio, the clinical impact of this is unknown. Compared to males, females had a higher symptom burden for nearly all recorded symptoms in our study, similarly to previously published literature in oncology which also reported sex differences in symptom burden and quality of life.7,8 Additionally, although increased co-morbidities has been previously shown to be correlated with a higher symptoms burden,9 we did not detect a statistically significant relationship in our retrospective study and future prospective studies are needed for further investigation. Non-teaching hospital was associated with higher rates of pain and depression and although the exact reason cannot be determined from our data, clinical outcomes are known to be differ- ent between teaching and non-teaching sites.10 Lastly, while the majority of patients in our study were taking novel drugs, these drugs were not associated with a decrease in symptom burden, suggesting that symptom management may require both effective anti-myeloma therapy as well as optimal supportive care services.
Comparison of our results to those of other studies on transplant-ineligible patients is difficult due to the hetero-
geneous populations included which encompass newly- diagnosed, relapsed as well as palliative patients.11,12 Despite these differences, the findings of our study are consistent with the results of a systematic review which also showed that severe fatigue and pain were common symptoms, with the pooled prevalence reaching more than 40% with anxiety/depression present in nearly 25% of the patients.13
A major strength of our study is that it is the largest, longitudinal study done on symptom burden among this group of patients using patient-reported outcomes. Our study utilizes real-world data with a focus on older adults with MM who are under-represented in clinical trials.14 Our study has several limitations. Our administrative database does not contain myeloma-specific variables, such as stage, response, or frailty status, which may be associated with symptom burden. Additionally, we did not capture symptoms during specific lines of treatment which may also be important as shown in a recent prospective study in which quality of life deteriorated with increasing line of treatment.15 The myeloma-defin- ing ‘CRAB’ features may also be under-reported or over- reported compared to those in prospectively conducted studies16 because of the limitations of diagnosis and billing codes in the administrative database. Similarly, retrospective collection of co-morbidities may also have led to under-reporting as noted in previous studiess.17 ESAS scores were only recorded during outpatient visits and potentially severe symptoms during hospital admis- sions may have been missed in our study. While the ESAS
haematologica | 2021; 106(7)
1993
