
Page 136 - 2021_07-Haematologica-web
P. 136
A. Tiede et al.
FVIII trough levels and protection from bleeding in patients with severe hemophilia A. Valentino et al.16 linked higher peak FVIII levels, higher area under the curve and time with FVIII >20 IU/dL (>20%) with increased protec- tion against joint and non-joint bleeding. den Uijl et al.7
suggested that joint bleeds decreased to approximately zero at FVIII levels >12% in patients with mild to severe hemophilia A. As such, it would be expected that FVIII trough levels of 15% would prevent most bleeds, consid- ering that patients with a FVIII trough of 15% are likely to
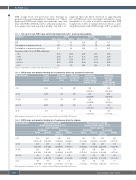
Table 3. Time spent at each FVIII:C range and bleeding characteristics after turoctocog alfa prophylaxis.
Parameters
PYE
Total numbers of spontaneous bleeds
Total numbers of spontaneous joint bleeds Proportion of time (%) in each FVIII activity range
0-1% >1-5% >5-15% >15-50% >50%
Pivotal Extension Adults/adolescents Children Adults/adolescents Children
Overall
815
1237 1055
14.36 26.38 24.17 27.48 7.85
Overall mean spontaneous joint ABR (negative binomial estimate, 95% CI)
3.44 (2.56-4.66) 2.28 (1.77-2.96) 1.99 (1.53-2.60) 0.67 (0.50-0.90) 0.15 (0.07-0.31)
77
287 251
15.58 27.27 25.97 28.57 3.90
23 498
37 776 24 684
21.74 12.85 26.09 26.10 21.74 25.50 21.74 29.32 8.70 6.22
217
137 96
16.60 26.73 20.73 23.04 12.90
FVIII: factor VIII; FVIII:C: factor VIII activity; PYE: patient-years of exposure.
Table 4. FVIII:C ranges and annualized bleeding rate of spontaneous bleeds and spontaneous joint bleeds.
FVIII activity range Patient years of exposure
Total number of spontaneous bleeds
Total number of spontaneous joint bleeds
241
335
337
133
9
Overall mean spontaneous ABR (negative binomial estimate, 95% CI)
4.16 (3.23-5.40) 2.65 (2.12-3.34) 2.14 (1.69-2.74) 0.76 (0.58-0.99) 0.21 (0.11-0.36)
0-1% 116.6 303
>1-5% 214.5 396
>5-15% 197.1 371
>15-50% 223.7 154
>50% 63.6 13
ABR: annualized bleeding rate; 95% CI: 95% confidence interval; FVIII: factor VIII; FVIII:C: FVIII activity.
Table 5. FVIII:C ranges and annualized bleeding rate of spontaneous bleeds by subgroup.
FVIII activity range
0-1%
>1-5%
>5-15%
>15-50%
>50%
Mean spontaneous ABR (negative binomial estimate, 95% CI) Analyses population
Mean spontaneous joint ABR (negative binomial estimate, 95% CI) Analyses population
By trial phase
By age group
By trial phase
By age group
Pivotal
7.16 (5.15-10.02) 4.15 (3.02-5.76) 2.95 (2.06-4.25) 0.99 (0.60-1.61) 0.47
(0.08-1.44)
Extension
2.15
(1.58-2.97)
1.69
(1.30-2.23)
1.64
(1.23-2.23)
0.66
(0.49-0.89)
0.19
(0.09-0.34)
Adults/ adolescents
4.86
(3.64-6.52)
3.29
(2.61-4.17)
2.64
(2.04-3.44)
0.92
(0.69-1.22)
0.35
(0.19-0.59)
Children
2.68
(1.61-4.60)
0.95
(0.49-1.90)
0.71
(0.40-1.27)
0.32
(0.16-0.64)
0.03
(0.00-0.15)
Pivotal
5.94 (4.01-8.94) 3.55 (2.46-5.22) 2.76 (1.87-4.10) 0.92 (0.55-1.52) 0.23 (0.01-1.02)
Extension
1.75 (1.23-2.56) 1.44 (1.07-1.98) 1.49 (1.09-2.08) 0.56 (0.40-0.79) 0.14 (0.06-0.31)
Adults/ adolescents
4.17 (3.02-5.83) 2.88 (2.22-3.78) 2.48 (1.89-3.28) 0.82 (0.60-1.13) 0.26 (0.12-0.50)
Children
1.83 (0.95-3.73) 0.67 (0.32-1.49) 0.58 (0.27-1.29) 0.23 (0.10-0.55) 0.00 (0.00-0.00)
ABR: annualized bleeding rate; 95% CI: 95% confidence interval; FVIII: factor VIII; FVIII:C: FVIII activity.
1906
haematologica | 2021; 106(7)
