
Page 45 - 2021_06-Haematologica-web
P. 45
Roles of ALDH in T-ALL
sequencing analysis demonstrated that TAL1 and its bind- ing partners (HEB, GATA3, RUNX1 and MYB) bind within the intron with the co-activator CBP and RNA polymerase II in Jurkat cells (Figure 1A). Knocking down each of these factors resulted in downregulation of ALDH1A2 mRNA expression in the same cell line, as determined by RNA- sequencing (Figure 1B, Online Supplementary Figure S1B). The result was validated at the protein level (Figure 1C). Importantly, the TAL1-bound region was associated with a high level of H3K27ac signals in multiple TAL1-positive
T-ALL cell lines but not in TAL1-negative cell lines (Figure 1A). This status corresponded to an ALDH1A2 mRNA expression pattern that was detected only in TAL1-posi- tive T-ALL cell lines (Figure 1D). Similarly, in the primary T-ALL cells from three independent cohorts,4,23,24 ALDH1A2 expression was significantly higher in the TAL1/2- and LMO1/2-subgroups than in the TLX, LYL/LMO and HOXA-positive subgroups (Figure 1E, Online Supplementary Figure S1C, Online Supplementary Table S1). Furthermore, the results from the analysis of the
AB
CD
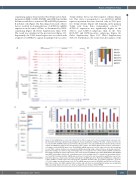
Figure 1. The ALDH1A2 gene is directly activated by the TAL1 complex in T-cell acute lymphoblastic leukemia cells. (A) Chromatin immunoprecipitation-sequencing gene tracks showing the binding of the TAL1 complex members, the co-activator CBP and RNA polymerase II (Pol II) in a TAL1-positive T-cell acute lymphoblastic leukemia (T-ALL) cell line (Jurkat), and H3K27ac marks in five TAL1-positive T-ALL cell lines, two TAL1-negative T-ALL cell lines, and normal T- cell samples at the ALDH1A2 gene locus. (B) ALDH1A2 mRNA expression levels in Jurkat cells after the knockdown of each TAL1 complex member were measured by RNA-sequencing using a dataset that we previously reported.21 Expression changes are shown as log2 fold-changes that are compared to the control samples (shGFP). (C) Western blot analysis showing the protein expression of the short isoform of ALDH1A2 upon TAL1, MYB, GATA3, HEB, RUNX1 and LMO1 knockdown in Jurkat cells. α-tubulin was used as the loading control. To evaluate the knockdown efficien- cy of each TAL1 complex member, mRNA expression level of each factor was measured by quantitative reverse tran- scription polymerase chain reaction and was normalized to ACTINB expression. Normalized mRNA level compared to control (shGFP) is shown. Error bars represent the standard deviation (SD) for technical replicates. *P<0.05, **P<0.01 using a two-tailed Student t test. (D) The mRNA expression levels of ALDH1A2 and TAL1 in four TAL1-pos- itive T-ALL cell lines, four TAL1-negative T-ALL cell lines and cells from one normal thymus sample were analyzed by RNA-sequencing. Expression values are shown as fragments per kilobase million (FPKM).
haematologica | 2021; 106(6)
1547
