
Page 26 - 2021_06-Haematologica-web
P. 26
Y. Mathangasinghe et al.
A
BCG
DEF
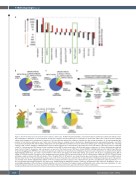
Figure 5. Hsp70 mediates protein repair function in mature erythrocytes. (A) Mass-fraction abundance of proteins in mature erythrocytes. Black bars indicate mass- wise enrichment or depletion of selected proteins and protein categories in total erythrocytes in comparison to unstressed Jurkat cells (control). Red bars indicate adjusted fold changes in the enrichment or depletion of selected proteins and protein categories normalized to the average abundance of all non-hemoglobin (Hb) proteins in total mature erythrocytes over Jurkat cells. Proteins linked to oxidative stress, cytoskeleton, ubiquitin/proteasome, glycolysis/tricarboxylic acid (TCA) cycle/pentose phosphate (PP), mitochondria, endoplasmic reticulum (ER) lumen and ribosomes were defined according to gene ontology annotations; the remaining categories (Hb, carbonic anhydrase, HSPA1A, Hsp70 system, Hsp60, Hsp90) were custom-defined. (B-C) Mass fractions of members of the Hsp70 system comprising of Hsp70, J-domain proteins (JDP) and nucleotide exchange factors (NEF) in unstressed Jurkat cells (B) and in mature erythrocytes (C). Values within brackets indicate mass fraction of Hsp70 chaperones and cochaperones as percent of the total proteome. NEF types include HSPBP1 and BAG-family proteins. Hsp110-type NEF vital for protein disaggregation (HSPH1-3) are indicated separately. A complete list of mass fractions of individual chaperones and cochaperones are provided in the Online Supplementary Tables S1-2. (D) Surface representation of the human 26S proteasome (PDB entry 5L4G). Core particle (CP) in green; regulatory particle (RP) in orange. (E-F) Mass fractions of members of the ubiquitin proteasome system (UPS) in unstressed Jurkat cells (E), and in mature erythrocytes (F). E1, E2 and E3 ubiq- uitin ligase enzymes indicated in different shades of blue. Ubiquitin (Ubi), CP, RP proteins are shown in yellow, green and orange, respectively. Values within brackets indicate mass fraction of the protein/protein groups as percent of the total proteome. Complete list of mass fractions of individual chaperones and cochaperones are provided in the Online Supplementary Tables S3-4. The analyzed proteomics datasets were obtained from Label-Free Quantification (LFQ) experiments.5,94,95,149 For each quantified protein/protein group, LFQ values were obtained from the MaxQuant software150 and were proportional to the mass-wise abundance of the cor- responding polypeptides. LFQ values were normalized by the sum of all LFQ values from a given sample and indicated as the relative mass-wise abundance of a pro- tein/protein group and termed as mass fractions. (G) Putative Hsp70-based protein repair-only functions in mature erythrocytes.
1528
haematologica | 2021; 106(6)
