
Page 232 - 2021_06-Haematologica-web
P. 232
Letters to the Editor
AB
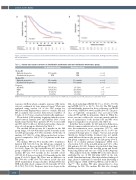
Figure 1. Survival outcomes in patients treated with and without lenalidomide maintenance post autologous stem cell transplant. (A) Progression free survival. (B) Overall survival.
Table 2. Survival and response outcomes in lenalidomide maintenance and non-lenalidomide maintenance groups.
Median OS
High risk cytogenetics Standard risk cytogenetics
Median PFS
High risk cytogenetics Standard risk cytogenetics
Response nCR & CR VGPR
PR
SD or less
No maintenance Group
45.3 months NYR
22.0 months
38.6 months
145 (45.2%) 114 (35.5%) 49 (15.3%) 13 (4.1%)
Maintenance Group
NYR NYR
53.0 months
59.9 months
297 (52%) 239 (41.9%) 24 (4.2%) 11 (1.9%)
P
<0.0001 <0.0001
<0.0001
<0.0001
0.05 <0.01
0.06 <0.01 0.08
NYR: Not yet reached; CR: complete response; nCR: near complete response;VGPR:very good partial response; PR: partial response; SD: stable disease.
response (nCR) in whom complete response (CR) status was not confirmed by bone marrow biopsy.15 Data was analyzed using version 9.4 of the SAS system for Windows with Kaplan-Meier curves to evaluate PFS and OS. χ2 analysis was used for dichotomous variables. A P-value of <0.05 was considered statistically significant.
We included 1,256 patients beginning induction treat- ment between January 2007 and January 2016. Seven hundred and twenty-three patients (57.6%) received LM and 533 (42.4%) did not. All relevant baseline character- istics of each group are illustrated in Table 1.
The median follow-up was 49.1 months in the LM group (range, 8.6–124.8 months) and 45.3 months in the non-LM group (range, 4.5–141.1 months). At the time of analysis, 397 (54.9%) of the LM group had not yet pro- gressed compared to 198 (37.2%) of patients in the non- LM group.
The median PFS was 58.2 months (95% Confidence Interval [CI]: 52.0–64.0) in the LM group compared to 34.6 months in the non-LM group (95%CI: 30.7–37.7, P<0.0001), Figure 1A. The 5-year OS was 81% in the LM group compared to 61.5% in the non-LM cohort. The median OS was 98.3 months in the non-LM cohort (95%CI: 83.5) but not reached (>124 months) in the LM group (P<0.0001, Figure 1B). There was no difference in PFS (P=0.66) or OS (P=0.75) between 21/28 day and 28/28 lenalidomide dosing schedules. Median PFS2 was NYR in the LM cohort compared to 64.2 months (95%CI: 55.3–74.8, P<0.0001). Response rates were deeper in the
LM cohort including nCR/CR (52.0% vs. 45.2%, P=0.05) and ≥VGPR (93.9% vs. 80.7%, P<0.01). The PFS benefit of lenalidomide persisted in those achieving a nCR/CR (P<0.0001), VGPR (P=0.0006) and PR (P=0.03). The pres- ence of high-risk cytogenetics was associated with reduced PFS and OS in all patients (Table 2). While the worse outcome could not be overcome entirely with the use of maintenance both median PFS and OS were improved regardless of cytogenetic risk (Table 2).
In further data available for 226 patient in Edmonton, Alberta common indication for dose reduction or medica- tion discontinuation were cytopenias (27.7%), rash (10.8%), infection (9.5%) and fatigue (8.1%). 19.6% dis- continued therapy prior to relapse. Venous and arterial thrombosis during frontline treatment was not signifi- cantly different between the groups at 2.6% in the non- LM group compared to 5.4% in the LM group (P=0.5). Rates of secondary primary malignancy (SPM) were observed in 6.4% of the non-LM group and 3.4% of the LM patients (P=0.32). Primary sites included skin, lung, bladder and prostate in the non-LM group and breast, brain, lung, kidney and one case of CLL in the LM group.
This analysis from the CMRG-DB is the first dataset analyzing the use of LM following ASCT in the real- world Canadian landscape. Our data validates findings of large, phase 3 randomized controlled trials illustrating a positive impact of LM on PFS and OS in a real-world set- ting.2,4,7-9 The median PFS data demonstrated a clear advantage for LM. The median OS data also strongly
1734
haematologica | 2021; 106(6)
