
Page 198 - 2021_06-Haematologica-web
P. 198
H. Larose et al.
ABC
DEF
GH
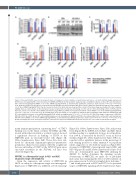
Figure 5. Silencing NOTCH1 expression in anaplastic large cell lymphoma cell lines inhibits cell proliferation and induces cell death. (A) Fold change expression of NOTCH1 over non-targeting (NT) control (normalized to GAPDH and PPIA) in the indicated ALK+ anaplastic large cell lymphoma (ALCL) cell lines 48 h after transduction with control non-targeting (NT) shRNA, or one of two shRNA targeting NOTCH1 as determined by quantitative polymerase chain reaction (**P<0.01; ***P<0.001; n=3). (B) Representative western blot for cleaved intracellular NOTCH1 (ICN) and α-tubulin in ALK+ ALCL cell lines 48 h after transduction with NT control shRNA, or one of three shRNA targeting NOTCH1. Only the relevant sections of the whole blot are shown and the contrast of the whole image was modified in order to improve legibility. Data are representative of three biological repeats. Densitometry is included as fold-change over the vehicle control and loading control. (C) Proliferation of ALK+ ALCL cell lines over the NT control shRNA, determined using an MTT assay 48 h after transduction with NT control shRNA, or one of two shRNA targeting NOTCH1 (*P<0.05; **P<0.01; ***P<0.001; n=3). (D) Quantification of the percentage of cells positive for annexin V and/or propidium iodide 48 h after transduction with NT control shRNA (left panel), or two shRNA targeting NOTCH1 (middle and right panels) (*P<0.05; ***P<0.001; n=3). (E-H) Fold-change of expression of HES1 (E), HEY1 (F), DTX1 (G) or MYC (H) over NT control shRNA transduced cells (normalized to GAPDH and PPIA) in the indicated ALK+ ALCL cell lines 48 h after transduction with NT control shRNA, or one of two shRNA targeting NOTCH1, as determined by quantitative polymerase chain reaction (*P<0.05; **P<0.01; ***P<0.001; n=3). All bar plots display the mean of biological replicates, and error bars represent standard deviations; the bar plots are color-coded as indicated in the Figure.
matin immunoprecipitation sequencing data37 of STAT3 binding sites in the ALCL cell lines SU-DHL1 and JB6, treated with either crizotinib or a vehicle control, showed a significant decrease in binding of STAT3 at the NOTCH1 gene in crizotinib-treated cells (Figure 4K, Online Supplementary Figure S4B). These data were vali- dated by chromatin immunoprecipitation–quantitative polymerase chain reaction analysis whereby a significant decrease in binding of STAT3 at the NOTCH1 gene upon crizotinib treatment in the SUP-M2 cell lines was observed (Figure 4L).
NOTCH1 is a therapeutic target in ALK– and ALK+ anaplastic large cell lymphoma
Given the expression and activity of NOTCH1 in ALCL, its utility as a therapeutic target was investigated. Expression of NOTCH1 was inhibited at both transcript
(Figure 5A, Online Supplementary Figure S5A) and protein levels (Figure 5B) by shRNA in both ALK+ and ALK– ALCL cell lines leading to a significant decrease in cell prolifera- tion at 48 h, as measured by the MTT assay, in all four cell lines (Figure 5C, Online Supplementary Figure S5B) con- comitant with a significant increase in the percentage of cells staining positive for either annexin-V or propidium iodide, suggestive of cell death by apoptosis (Figure 5D). As expected, NOTCH1’s transcriptional targets HES1 and HEY1 (Figures 5E and 5F, Online Supplementary Figure S5A) were also downregulated upon NOTCH1 silencing by shRNA. To further determine the signaling cascade downstream of NOTCH1, we made use of published microarray data examining the effect of GSI treatment on gene expression in T-cell acute lymphoblastic leukemia,38- 40 and found genes such as MYC and DTX1 to be potential targets of NOTCH1 signaling (Online Supplementary Figure
1700
haematologica | 2021; 106(6)
