
Page 261 - 2021_05-Haematologica-web
P. 261
Letters to the Editor
signal in BM compared to PB, especially at late time- points (Figure 1C) and a moderate correlation between the two measurements (R2=0.7; P<0.0001) (Figure 1D). Among several models tested, the best results in terms of relapse prediction were achieved for both PB and BM
considering positive only those samples with increasing mixed chimerism of more than 19.4% the value of the previous determination. This threshold accounts for the 95% confidence interval (95% CI) of experimental error of the quantitative PCR technique (see Online
A
BCD
FGH
IJK
E
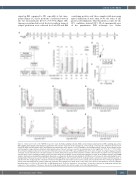
Figure 1. Outline and results of the KIM-PB prospective study. (A) Study sampling schedule. White arrows indicate peripheral blood (PB) sampling, gray arrows BM sampling. (B) Diagram summarizing the enrollment and outcome of patients in the study group. (C) Percentage of host-specific chimerism detected in 97 paired PB (white box-and-whisker plots) and BM (gray box-and-whisker plots) samples collected during the post-transplantation follow-up. Boxes display median and interquartile range, whiskers minimum and maximum values. Paired t tests were used for all comparisons (ns=not significant; *P<0.05; ****P<0.0001). (D) Correlation analysis between the host-specific chimerism values detected in PB (x axis) and BM (y axis) in the same 97 pairs of samples displayed in panel C. Results of a two-sided Pearson correlation analysis are shown, with a linear regression line and 95% confidence interval (95% CI). (E) Receiver operating char- acteristic (ROC) curves, showing sensitivity (y axis) and 1-specificity in percentages (x axis) obtained by taking into account 19 PB samples (full line) and 14 BM samples (dashed line) showing increasing mixed chimerism as compared to the previous determination. (F-K) Kinetics of host-specific chimerism during the post- transplantation follow-up measured in the PB (panels F-H) and BM (panels I-K) of patients from the study group who experienced relapse (leftmost panels), of patients from the study group who remained in remission throughout the observation period (center panels) and of patients from the control group (rightmost panels). Red diamonds indicate samples with host chimerism increasing by more than 19.4% of the value of the previous determination, and exceeding the threshold values of 0.13% for PB and 0.24% for BM (dashed lines). These are defined as “true positives” if they were observed in study group patients who relapsed, or “false positives” if they were observed in study group patients who did not relapse or in control group patients.
haematologica | 2021; 106(5)
1481
