
Page 197 - 2021_05-Haematologica-web
P. 197
ITP associated with MDS and CMML
MDS/CMML (+4 to +111 months) in eight (20%) patients (Online Supplementary Figure S1). The median platelet count was 15 x 109/L (range, 1-90) at ITP diagnosis, and the nadir platelet count was 8 x 10⁹/L. Twenty-nine per- cent (11/38) of the patients had a high bleeding score (Khellaf score >8). Platelet transfusion therapy was inef- fective in 78% (14/18) of the patients. An isotopic meas- urement of platelet lifespan carried out in four patients revealed a major reduction in the average platelet lifespan for all patients, with a median of 2.75 (range, 1-4) days. The assessment of the site of platelet destruction revealed a purely or predominantly splenic pattern for two patients and a mixed (hepatic and splenic) pattern for the other two patients. Antiplatelet antibodies detected by the monoclonal antibody immobilization of platelet antigens (MAIPA) assay were found in seven of 16 (44%) patients (4 patients with a positive direct MAIPA only, and 3 patients with both direct and indirect positive MAIPA), and autoimmune hemolytic anemia was observed in five patients.
Comparison of patients with immune thrombocytopenia with or without myelodysplastic syndrome/chronic myelomonocytic leukemia
MDS/CMML-associated ITP patients were matched to 75 primary ITP controls without MDS/CMML (median age: 76 years [range, 35-92]; 39% women) from the CAR- MEN registry (Table 1). The platelet count at the time of ITP diagnosis was not significantly different between patients in the MDS/CMML-associated ITP group (15 x 109/L [range, 1-90]) and those in the primary ITP group (11 x 109/L [range, 1-91]; P=0.39), with similar rates of a high hemorrhagic score (Khellaf score >8) (29% vs. 28%, P=0.92). However, MDS/CMML-associated ITP patients had a higher incidence of severe bleeding (26% vs. 4%, P=0.0009) involving the central nervous system (n=3), gas- trointestinal tract (n=2) and other sites (n=3). Polyclonal hypergammaglobulinemia (γ-globulin level >14 g/L) tend- ed to be more frequent in the MDS/CMML-associated ITP group (35%) than in the primary ITP group (18%) (P=0.07).
Comparison of patients with myelodysplastic syndrome/chronic myelomonocytic leukemia with and without immune thrombocytopenia
MDS/CMML-associated ITP patients were matched to 200 MDS/CMML controls without ITP (median age: 78 years [range, 28-92]; 38% women) from the GFM registry (Table 1). The distribution of MDS and CMML subtypes was similar in the two groups (MDS/CMML with or without ITP) (Online Supplementary Figure S2). The most frequent MDS subtypes were MDS with multilineage dysplasia (53% of cases of MDS/CMML with associated ITP and 39% of cases of MDS/CMML without ITP), MDS with single lineage dysplasia (29% and 17%, respectively) and MDS with excess blasts (12% and 15%, respectively). The proportion of secondary MDS was not different between groups, accounting for 10% of cases of MDS/CMML with ITP (chemotherapy [n=3], exposure to solvents [n=1] or radioactivity [n=1]) and 14% of those with MDS/CMML without ITP.
MDS/CMML patients with ITP had a lower platelet count than MDS/CMML patients without ITP (median 15 x 109/L vs. 137 x 109/L, P<0.0001), without significant differences concerning hemoglobin levels, neutrophil and monocyte counts, the number of bone marrow blasts and the median IPSS-R score. The rates of karyotypic abnor- mality were similar between groups (29% vs. 32%, P=0.73). The most frequent abnormalities were 20q (n=4) and Y (n=4) deletions. The frequency of 20q deletion in the group with MDS/CMML and ITP was higher than that in the group with MDS/CMML without ITP (40% vs. 6%, respectively, P=0.002). Approximately 20% of patients in each group (22% of the group with MDS/CMML and ITP; 23% of the group with MDS/CMML without ITP) received a specific hematolog- ic treatment for myelodysplasia: hydroxyurea (n=5/41 in the MDS/CMML with ITP group and n=25/200 in the MDS/CMML without ITP group), azacytidine (n=4/41 and none, respectively), allogeneic bone marrow trans- plant (n=1/41 and n=4/200, respectively) or other thera- pies (n=2/41 and n=11/200, respectively).
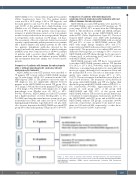
Figure 1. Flow chart of patients with immune thrombocytopenia and myelodysplastic syndrome/chronic myelomonocytic leukemia in the study. ITP: immune thrombocytopenia; MDS: myelodysplastic syndrome; CMML: chronic myelomonocytic leukemia; IVIg: intravenous immunoglobulin.
haematologica | 2021; 106(5)
1417
