
Page 267 - 2021_04-Haematologica-web
P. 267
Letters to the Editor
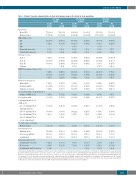
Table 1. Patients’ baseline characteristics at study entry by age group in the intent-to-treat population.
≥75 years (n=61)
65–74 years (n=122)
<65 years (n=124)
Age (years) Mean (SD) Median (range)
MM subtype, n (%) IgG
IgA
IgM
Kappa light chain only Lambda light chain only
ISS stage*, n (%) Stage I
Stage II Stage III Unknown
ECOG Performance Status, n (%)
0 1 2
Cytogenetic risk†, n (%) High-risk CA Standard-risk CA Unknown or missing
N. of patients with a medical history of
Isa-Pd (n=32)
77.9 (2.0) 77 (75-83)
1 (3.1)
1 (3.1)
7 (21.9) 12 (37.5) 13 (40.6) 0
9 (28.1) 18 (56.3) 5 (15.6)
7 (21.9) 20 (62.5) 5 (15.6)
5 (15.6) 30 (93.8)
10 (33.3)
13 (43.3) 6 (20.0) 0
3 (2–11)
27 (84.4) 32 (100) 32 (100)
7 (21.9) 6 (18.8) 3 (9.4)
Pd (n=29)
78.3 (3.2) 78 (75-86)
2 (6.9)
1 (3.4)
4 (13.8) 12 (41.4) 12 (41.4) 1 (3.4)
14 (48.3) 8 (27.6) 7 (24.1)
11 (37.9) 9 (31.0) 9 (31.0)
5 (17.2) 27 (93.1)
11 (40.7)
9 (33.3) 5 (18.5) 1 (3.7)
3 (2–10)
29 (100) 29 (100) 29 (100)
3 (10.3) 4 (13.8) 0
Isa-Pd (n=68)
69.4 (2.9) 69 (65-74)
45 (66.2)
Pd (n=54)
69.0 (2.5) 69 (65-74)
32 (59.3)
Isa-Pd (n=54)
56.5 (5.9) 57.5 (36-64)
5 (9.3)
3 (5.6)
26 (48.1) 19 (35.2) 7 (13.0) 2 (3.7)
22 (40.7) 29 (53.7) 3 (5.6)
8 (14.8) 36 (66.7) 10 (18.5)
4 (7.4) 49 (90.7)
20 (40.8)
8 (16.3) 6 (12.2) 1 (2.0)
3 (2–10)
52 (96.3) 54 (100) 54 (100)
2 (3.7) 6 (11.1) 1 (1.9)
Pd (n=70)
57.0 (6.1) 58 (41-64)
47 (67.1)
21 (65.6) 9 (28.1)
22 (75.9) 4 (13.8)
38 (70.4) 7 (13.0)
17 (25.0)
0 0 1(1.5) 0 1(1.9) 0
2 (2.9)
3 (4.4)
31 (45.6) 22 (32.4) 14 (20.6) 1 (1.5)
24 (35.3) 36 (52.9) 8 (11.8)
9 (13.2) 47 (69.1) 12 (17.6)
7 (10.3) 63 (92.6)
31 (49.2)
14 (22.2) 7 (11.1) 0
3 (2–8)
60 (88.2) 68 (100) 68 (100)
1 (1.5) 7 (10.3) 0
19 (35.2) 1 (1.9)
18 (25.7) 4 (5.7)
Asthma or COPD, n (%) N. of patients with
renal impairment‡, n (%) eGFR, n (%)
2 (3.7)
18 (33.3) 23 (42.6) 13 (24.1) 0
18 (33.3) 31 (57.4) 5 (9.3)
6 (11.1) 32 (59.3) 16 (29.6)
8 (14.8) 51 (94.4)
25 (49.0)
12 (23.5) 4 (7.8) 0
3 (2–6)
51 (94.4) 54 (100) 54 (100)
7 (13.0) 9 (16.7) 3 (5.6)
1 (1.4)
29 (41 .4) 21 (30.0) 18 (25.7) 2 (2.9)
37 (52.9) 29 (41.4) 4 (5.7)
19 (27.1) 37 (52.9) 14 (20.0)
4 (5.7) 67 (95.7)
33 (49.3)
11 (16.4) 7 (10.4) 0
3 (2–7)
68 (97.1) 70 (100) 70 (100)
2 (2.9) 8 (11.4) 1 (1.4)
≥60-<90 mL/min/1.73 m2 (mild impairment) ≥45-<60 mL/min/1.73 m2 ≥30-<45 mL/min/1.73 m2 ≥15-<30 mL/min/1.73 m2 (severe impairment)
N. of prior lines of therapy,
Median (range) Prior therapy, n (%) Alkylating agent
Proteasome inhibitor
Lenalidomide
Refractory status, n (%)
Lenalidomide refractory
PI refractory
Lenalidomide and PI refractory
*International Staging System staging was derived based on the combination of serum β -microglobulin and albumin concentrations. †High risk chromosomal abnormal- 2
ities were defined as the presence of del(17p), and/or t(4;14), and/or t(14;16) by fluorescence in situ hybridization. Cytogenetics was performed by a central laboratory with a cut-off of analyzed plasma cells of 50% for del(17p), and of 30% for t(4;14) and t(14;16). ‡Renal impairment was defined as an estimated glomerular filtration rate <60 mL/min/1.73 m2 as determined using the Modification of Diet in Renal Disease (MDRD) equation. Isa: isatuximab: Pd: pomalidine and dexamethasone; SD: standard deviation; MM: multiple myeloma; Ig: immunoglobulin; ISS: International Staging System; ECOG: Eastern Cooperative Oncology Group; CA: chromosomal abnormalities; COPD: chronic obstructive pulmonary disease; eGFR: estimated glomerular filtration rate; PI: proteasome inhibitor.
haematologica | 2021; 106(4)
1183
