
Page 263 - 2021_04-Haematologica-web
P. 263
Letters to the Editor
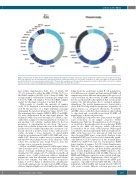
Figure 2. Frequencies of major chronic lymphocytic leukemia stereotyped clonotypes. The major chronic lymphocytic leukemia (CLL) stereotyped clonotypes were few, expressed at very low frequencies and did not follow the trend observed in CLL. The relative frequencies of major stereotypes in the present study was distinct from the one we previously reported in CLL.5 Characteristic examples were the low relative frequencies of subsets #1 and #2 as well as the complete absence of B-cell receptor immunoglobulins belonging to subsets #8, #16, #31, #59 and #99.
fied (Online Supplementary Table S3), of which 216 (97.3%) belonged to either the MBL (70/222, 31.5%) or the PBMC samples (146/222, 65.8%) from LC-MBL. The average number of abundant clonotypes per sample was 6.4 for the MBL cell samples, 9.8 for the PBMC samples and ≤1 for all sample categories of normal B cells.
With regards to clonality, the majority of samples (9/12, 75%) displayed a monoclonal pattern character- ized by the presence of a single abundant clonotype dominating the repertoire (frequency range, 42.5-97.9%). The remaining three samples (MBL-5, MBL-10 and MBL- 12) were characterized by an oligoclonal pattern. The median LC-MBL clone size was large (6.5 cells/mL), espe- cially when compared to that in populations of Asian ori- gin (median: 0.12 cells/mL),9 perhaps linked to the low prevalence of oligoclonality in our cohort. The assess- ment of the relation between the size of the MBL clone and the level of clonality (Spearman rho correlation coef- ficient) showed a positive trend, in line with previous studies showing a lower frequency of oligoclonality along the spectrum from LC-MBL to HC-MBL and, even- tually, CLL.9 However, results were not statistically sig- nificant (P=0.18), perhaps because of the small size of the cohort. No correlations were found between clone size and age, sex or cytogenetic aberrations.
All but one PBMC sample from LC-MBL carried abun- dant clonotypes (10/11, 90.9%), yet a relatively high-fre- quency clonotype (individual frequency of >6%) was identified in 3/11 samples (27.3%). Finally, normal B-cell samples were clearly polyclonal without significant expansions; only four abundant clonotypes were identi- fied in two samples, but with very low frequencies (range, 1.1-1.8%). Figure 1 illustrates the clonality pat- terns in all sample groups. As expected, LC-MBL cell pop- ulations displayed high levels of clonality, thus clearly dif-
fering from the polyclonal normal B-cell populations. Such differences in clonality patterns among LC-MBL cell samples may reflect different timepoints in the process of clonal evolution. In other words, LC-MBL could initially involve a polyclonal B-cell population that at some point acquires the CLL phenotype due to sustained antigenic stimulation. The specific immunogenetic characteristics of the BcR IG along with the progressive acquisition of genetic lesions, e.g., cytogenetic alterations,10 by individ- ual MBL clones could drive their expansion, thus leading to oligoclonal and, eventually, monoclonal LC-MBL cell populations, as proposed previously.9
The IGHV gene repertoire was characterized by signif- icant restrictions in all sample categories (Online Supplementary Table S4). The application of a 5% frequen- cy cutoff led to the identification of seven frequent IGHV genes in the MBL cell category, which collectively accounted for 38.1% of the total repertoire. With regard to normal B cells from individuals with and without LC- MBL, restrictions were less pronounced with four and three frequent IGHV genes, respectively. Analysis at the individual IGHV gene level revealed statistically signifi- cant differences in the expression of two frequent genes (IGHV3-23, IGHV3-30) and ten low-frequency IGHV genes (analysis of variance, P<0.05) (Online Supplementary Table S5, Figure 2). These differences concerned mostly the category of normal B cells from healthy individuals who, overall, displayed a distinct IGHV repertoire com- pared to that of individuals with LC-MBL. Biases in the IGHD and IGHJ gene repertoires were evident in all sam- ple categories (Online Supplementary Tables S6 and S7). Overall, the existence of distinct biases in the IGHV gene repertoire, especially between CD5+ CLL-like cells from individuals with LC-MBL and normal (mostly CD5–) B cells, point towards different selection processes and
haematologica | 2021; 106(4)
1179
