
Page 48 - 2021_03-Haematologica-web
P. 48
G.I. Gavriilidis et al.
were performed with the use of GraphPad Prism 5 software (La Jolla, CA, USA), and R. Detailed information about the statistical analysis can be found in the Online Supplementary Methods.
Results
Chronic lymphocytic leukemia cells predominantly express the membrane isoform of stem cell factor
First, we investigated the expression profile of KITLG gene splice variants in CLL cells by RQ-PCR analysis. Using specific primers for each variant, we observed that CLL cells expressed transcripts that encode the mem- brane (KL-2) isoform only, albeit generally at lower levels than the control HL-60 promyelocytic leukemia cells (Online Supplementary Figure S1A-C).
Next, we investigated SCF protein expression in CLL cells by western blotting analysis, utilizing a monoclonal antibody that recognizes a common epitope in the com- mon extracellular domain (N-terminus) of both SCF iso- forms, and detected a single band at 37 kDa.27,28 We also used an antibody specific for the KL-1 isoform which rec- ognized the protein domain encoded by the exon 6-7 junction and detected a significantly weaker single band at 32 kDa (Online Supplementary Figure S1D and E). On these grounds, we concluded that CLL cells predominant- ly express the membrane (KL-2) SCF isoform.
High stem cell factor expression is an adverse prognosticator in chronic lymphocytic leukemia
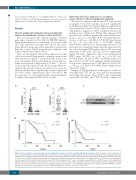
Western blot analysis with an anti-SCF antibody that recognized both SCF isoforms disclosed significantly (fold-difference [FD]: 9.8; P<0.001) higher overall SCF lev- els in negatively selected CD19+ tumor B cells from 69 CLL patients compared to CD19+ tonsillar B cells from 13 healthy donors (Figure 1A). Within CLL, increased SCF protein levels correlated significantly with CD38 positiv- ity (nCD38+=17, nCD38-=51, FD:2.35; P=0.03), ZAP70 positiv- ity (nZAP70+=20, nZAP70-=30, FD: 2.9; P=0.0167) and trisomy 12 (nTri12+=8, nTri12-=43, FD: 3; P=0.0488) (Online Supplementary Figure S2A-C). Interestingly, increased SCF protein levels correlated strongly with the mutational sta- tus of the clonotypic IGHV genes; indeed, CLL cases with unmutated IGHV genes (U-CLL) showed significantly higher SCF levels compared to those cases with mutated IGHV genes (M-CLL) (nU-CLL=38, nM-CLL=30; FD: 6.6; P<0.001) (Figure 1B and C). Flow cytometry analysis for the detection of SCF+ cells confirmed significantly higher SCF protein expression in U-CLL than in M-CLL (nU- CLL=16, nM-CLL=9, FD:4.9; P=0.0086) (Online Supplementary Figure S2D and E).
Analysis of SCF protein levels with regard to overall sur- vival (OS) and TTFT in CLL cases revealed that patients with high SCF protein levels (SCFhigh) had significantly shorter OS (P<0.001) and TTFT (P<0.001) compared to
ABC
D
E
Figure 1. Stem cell factor is overexpressed in chronic lymphocytic leukemia cells and correlated with adverse prognosis. (A, B) Comparison of the expression of stem cell factor (SCF) protein in chronic lymphocytic leukemia (CLL) cells compared to healthy tonsillar B cells (A) and in IG-unmutated (U-CLL) compared to IG-mutat- ed (M-CLL) cells, showing overexpression in U-CLL cases (B). The dot plots show SCF protein levels normalized to β-actin from western blot studies. Each dot repre- sents one case. (C) Representative western blot for the distinct SCF probing in samples from healthy tonsils, U-CLL and M-CLL cases. (D, E) SCFhigh cases have shorter overall survival (OS) (D) and shorter time-to-first treatment (TTFT) (E) compared to SCFlow cases, as shown by Kaplan-Meier OS and TTFT curves for CLL patients with high SCF expression (normalized SCF protein levels to β-actin >1.7 for OS and >0.93 for TTFT) and low SCF expression (normalized SCF protein expression to β-actin ≤1.7 for OS and ≤0.93 for TTFT). Cut-off points were generated using time-dependent receiver operating characteristic curve analysis. The Mann–Whitney U and the log-rank test were applied as appropriate to evaluate statistical significance; *P<0.05, **P<0.01, ***P<0.001.
694
haematologica | 2021; 106(3)
