
Page 259 - 2021_03-Haematologica-web
P. 259
Letters to the Editor
six mutations in shFAM122A#1-expressing NB4 cells (designated shFAM122A#1/FAM122A-6m) was confirmed by western blot (upper panel). The growth of the indicated cells was also monitored by a cell counter (lower panel). (F) FAM122A-knockdown NB4 cells were observed under microscopy and photographed (upper panels, scale bar = 100 mm) after transduction with lentiviruses expressing shRNA for 4 days, and their degree of apoptosis was analyzed by calculating annexinV+/propidium iodide+ cells with flow cytometry (FACS) (bottom panels). (G) FAM122A knockdown U937 and THP1 cells, together with their correspon- ding control cells, were subjected to FACS analysis for apoptosis after infection with shRNA viruses for 6 days (left panels). (F, G) The analyzed quantification data are shown on the right of the FACS data. *P<0.05, **P<0.01 and ***P<0.001, compared with the corresponding shScramble cells. #P<0.01 compared with shFAM122A#1-expressing cells.
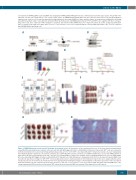
Figure 2. FAM122A promotes acute myeloid leukemia development in vivo. (A) Schematics of the experimental process of the bone marrow transplantation assay. MLL-AF9-expressing mouse leukemic cells were infected with GFP-tagged shControl or shFam122a lentiviruses. Flow-sorted GFP+ cells were assayed to verify the knockdown effect and colony forming ability. Subsequently, 2,000 or 5,000 GFP+ cells, mixed with 2x10⁵ normal bone marrow cells, were transplanted into lethally irradiated recipient mice for survival calculation. (B, C) GFP+ MLL-AF9 leukemia cells from each shRNA condition were assessed for FAM122A knock- down effects (B) and colony formation (scale bar = 100 mm) (C). (D) Kaplan-Meier survival curve analysis of mice transplanted with 2,000 or 5,000 purified MLL- AF9 cells expressing GFP-tagged shControl or shFam122a (n=5; log-rank test). (E-H) Animals were transplanted with 2,000 acute myeloid leukemia (AML) cells and after 21 days the percentages of GFP+/YFP+ cells in peripheral blood, bone marrow and spleen from indicated recipient mice were analyzed by flow cytom- etry (E). The spleens (F) and livers (G) of indicated mice were photographed and weighed. Images of hematoxylin & eosin-stained specimens of liver and spleen from indicated mice (H) were observed by microscopy (scale bar = 100 mm). **P<0.01 and ***P<0.001 compared with shControl-expressing AML mice. CFU: colony-forming unit; GFP: green fluorescent protein; YFP: yellow fluorescent protein; BM: bone marrow; PB: peripheral blood; SP: spleen.
AB
CD
EF
GH
haematologica | 2021; 106(3)
905
