
Page 206 - 2021_03-Haematologica-web
P. 206
V. Wiebking et al.
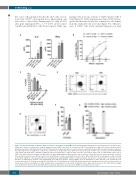
the source cell population besides the aβ T cells, we fol- lowed the CD19+ cell population by phenotyping and were able to detect their disappearance as early as 24 h after gene targeting (2.53%, vs. 7.9-11.8% in the control condition in which the T cells did not express CAR), sug-
gesting early cytotoxic activity of CD19-specific CAR T cells (Figure 3C, Online Supplementary Figure S2D). Follow- up showed that the cell product continued to self-deplete from the residual B cells over time (Figure 3C). The pres- ence of CD19+ cells in the manufacturing process may
AB
CE
FG
D
Figure 3. In vitro functionality of chimeric antigen receptor T cells engineered from aβ+ T cells. (A) Interleukin-2 and interferon-γ concentrations in cell culture super- natant after culture of control cells or chimeric antigen receptor (CAR) T cells alone, or co-cultures of CAR T cells with Nalm6 or Raji cells. Control cells were treated with ribonucleoprotein only (TRAC knockout without CAR expression). Bars and error bars represent mean ± standard deviation (SD) from three biological replicates. Asterisks depict levels of significance compared to control cells as analyzed by t tests. (B) In vitro cytotoxicity assay of CAR T cells co-cultured for 20 h with Nalm6 cells or Raji cells (both CD19+ and GFP+) at different effector-to-target ratios. Counts of viable cells were assessed for target cells co-cultured with control cells or CAR T cells and the fraction of target cells killed was calculated using samples without effector cells as reference. Bars and error bars represent means ± SD from three biological replicates and asterisks depict levels of significance (t tests). (C) Quantification of B cells for differentially treated cell populations on day 1 and day 4 after gene editing, for cell populations that had undergone gene targeting (RNP + AAV) or control treatments. Groups were compared by t tests and levels of sig- nificance are indicated by asterisks. (D-G) Phenotyping of the CAR T-cell product, gated on NGFR+ cells. (D) Distribution of CD4+ and CD8+ cells. (E) Expression of memory and effector T-cell markers among CD4+ and CD8+ cells. (F) Quantification of CD4/CD8 distribution from four biological replicates. Bars and error bars rep- resent mean ± SD. (G) Quantification of the memory/effector populations on cells from four different donors. Bars represent mean ± SD. CAR: chimeric antigen receptor; IFN: interferon; IL: interleukin; RNP: ribonucleoprotein; AAV: adeno-associated virus, NGFR: nerve growth factor receptor.
852
haematologica | 2021; 106(3)
