
Page 57 - 2021_02-Haematologica-web
P. 57
Risk stratification of CMV recurrence after HSCT
Figure 3 (previous page). Performance of cytomegalovirus (CMV) cell-mediated immunity measured around day 100 after hematopoietic stem cell transplantation to predict freedom from and occurrence of late recurrent CMV reactivation (post-hoc). (A) Interferon-γ enzyme-linked immunospot (ELISpot) tests performed between day 80 (d80) and day 100 (d100) after hematopoietic stem cell transplantation in patients with an earlier CMV reactivation were used for the analysis. In the case that several measurement were available, the one closest to day 100 was considered. (B) Quantitative ELISpot results in response to CMV IE-1 and pp65 proteins were evaluated as detailed in the legend to Figure 2. Differences in spot-forming cell (SFC) distribution between patients with a CMV reactivation before day 100 only and those with a late (after day 100) recurrent CMV reactivation were evaluated using a Mann-Whitney U test. The median and interquartile range of the squared mean of square-root-transformed (SRM^2) SFC are shown above each graph. Additional information (minimum, maximum, 10th and 90th percentiles) are shown in Online Supplementary Table S4. Due to the log scale representation, values of zero SRM^2 were replaced by 0.01 (y-axis), meaning that baseline values shown at y=0.01 are actually equal to zero. Red triangles and blue dots represent negative and positive tests, respectively, defined according to the rules described in the Online Supplementary Methods. (C) Prediction of late recurrent CMV reactivation based on IE-1- and pp65-specific SFC counts measured around day 100 was eval- uated by receiver operating characteristic curve analysis, as detailed in the legend to Figure 2. (D) Cumulative incidence of recurrent CMV reactivation based on IE- 1- and pp65-specific qualitative test results around day 100, was evaluated as detailed in the legend to Figure 2. Median (range) follow up time after T-Track® CMV measurement was 132 (59-145) days in (censored) patients with no documented late recurrent CMV reactivation. The median (range) time to late recurrent CMV reactivation after T-Track® CMV measurement was 119 (105-165) days. Moreover, the last recurrent CMV event in the case of a pp65- (and T-Track® CMV)-positive test result occurred 31 days after the day-100 measurement, compared to 77 days in the case of a pp65- and IE-1-negative test result. CMI: cell-mediated immunity; HSCT: hematopoietic stem cell transplantation; IQR: interquartile range; MWU: Mann-Whitney U test; D-/R+: CMV-negative donor/CMV-positive recipient; AUC: area under curve; 95% CI: 95% confidence interval; HR: hazard ratio.
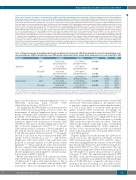
Table 5. Diagnostic accuracy in identifying patients with and without late (beyond day 100 after hematopoietic stem cell transplantation) recur- rent cytomegalovirus (CMV) reactivation based on CMV-specific negative and positive enzyme-linked immunospot test results at day 80 to 100.
Population
All patients
D-/R+ patients
Marker
IE-1 pp65 IE-1, pp65a IE-1
pp65 IE-1, pp65a
Sensitivity
76.9% (10/13) [95% CI: 46.2-95.0%]
75.0% (9/12) [95% CI: 42.8-94.5%]
69.2% (9/13) [95% CI: 38.6-90.9%]
76.9% (10/13) [95% CI: 46.2-95.0%] 75.0% (9/12) [95% CI: 42.8-94.5%] 69.2% (9/13) [95% CI: 38.6-90.9%]
Specificity
60.0% (18/30) [95% CI: 40.6-77.3%]
96.7% (29/30) [95% CI: 82.8-99.9%]
96.7% (29/30) [95% CI: 82.8-99.9%]
20.0% (2/10) [95% CI: 2.5-55.6%] 90.9% (10/11) [95% CI: 58.7-99.8%] 90.9% (10/11) [95% CI: 58.7-99.8%]
Chi-square
P=0.026
P<0.001 P<0.001
P=0.859 P=0.001 P=0.003
PPVb
-
- -
55.6% (10/18) 90.0% (9/10) 90.0% (9/10)
NPVb
-
- -
40.0% (2/5) 76.9% (10/13) 71.4% (10/14)
aT-Track® CMV assay: test is positive when at least one of the IE-1- and/or pp65-specific response is positive, and the test is negative when both IE-1- and pp65-specific responses are negative;bPositive and negative predictive values were not calculated in the“all patients”population because of the imbalance toward donor-negative/recipient-positive pairs in that group. 95% CI, 95% confidence interval; CMV, cytomegalovirus; D/R, donor/recipient CMV serostatus; NPV, negative predictive value; PPV, positive predictive value.
cific for CMV accumulate in patients with recurrent CMV reactivation.51 Thus, functionality (i.e., the capacity of cells to respond to antigen stimulation) rather than the number of T cells is more likely to accurately reflect protection against recurrent CMV reactivation. Accordingly, we observed several cases of discordant absolute CD8+ T cell counts and IFN-γ ELISpot measurements in favor of the ELISpot assay, in particular cases of high CD8+ T-cell count together with low T-Track® CMV results prior to or during CMV reactivation episodes (data not shown). Therefore, CMV-specific immune monitoring using a standardized assay, while complementing the current approach of absolute T-cell count monitoring, provides an additional value for the risk stratification of recurrent CMV reactiva- tion in HSCT patients.
Negative ELISpot test results after the first CMV reacti- vation and at day 100 predicted subsequent recurrent CMV reactivation with a PPV of 80% and 90%, respec- tively. Measuring pp65-specific response at day 100 rather than directly after the end of a first CMV reactivation also improved the NPV (77% vs. 54%, respectively). This sug- gests that measuring CMV-CMI at the fixed time point of day 100 might be of greater clinical relevance to predict recurrence of CMV. The apparent improvement in NPV (and PPV) of the day-100 measurement might be in part due to the overall later measurement time (median [range] time of 93 [80-100] days), compared to the time of meas- urement at the end of treatment for a first CMV reactiva- tion, which ranged from day 45 to 186 after transplanta-
ing to steer the duration of antiviral prophylaxis based on CMV-CMI monitoring using T-Track® CMV (ClinicalTrials.gov Identifier: NCT02538172).
The finding that the IFN-γ ELISpot assay measured after a first CMV reactivation performs at least as well as the measurement of absolute lymphocyte subset counts to predict subsequent CMV reactivation offers the attractive possibility of introducing T-Track® CMV in complement to the currently implemented absolute T-cell count meas- urement to improve risk stratification of recurrent CMV after HSCT. The value of absolute lymphocyte counts13,34,35 and of absolute lymphocyte subsets15,17,32,36–40 to predict CMV infection and/or recurrence is well documented, in line with the described protective role of CD4+, CD8+, γd T and NK cells against CMV reactivation.15,40–48 In general, absolute T-cell counts recovery correlates well with CMV- specific T-cell reconstitution in vivo,17,32,47,49 and absolute lymphocyte, CD4+ and/or CD8+ T-cell counts have been proposed as surrogate markers for CMV-specific cellular immunity.34,35,47 The good predictive value of absolute lym- phocyte counts probably explains the improved perform- ance of the ELISpot assay observed upon normalization to absolute lymphocytes, which might be a relevant normal- ization method in HSCT patients.
On the other hand, absolute T-cell counts do not always reflect CMV-specific immune reconstitution.49,50 Recovery of CMV-specific T cells is often delayed relative to that of bulk T cells, especially in patients with recurrent CMV reactivation.49 Moreover, dysfunctional CD8+ T cells spe-
haematologica | 2021; 106(2)
371
