
Page 52 - 2021_02-Haematologica-web
P. 52
E. Wagner-Drouet et al.
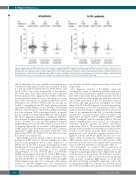
Figure 1. Cytomegalovirus (CMV) viral load at start of the first, second and third CMV reactivations. Median (range) CMV viral load (VL) at the time of the first, second and third CMV reactivations is shown for all patients and high-risk CMV-negative donor/CMV-positive recipient (D-/R+) pairs. It should be emphasized that VL meas- urements were not standardized among centers. CMV load was measured by quantitative polymerase chain reaction from whole blood (9 centers) or plasma (1 cen- ter) using either a commercial assay (Abbott RealTime CMV; 2 centers) or validated in-house protocols and equipment (8 centers). Accordingly, treatment-requiring viral load thresholds were center-specific and no analysis correlating spot-forming-cell counts to VL was planned in this study.
and 14 thereafter. The first available measurement was considered for the analysis. In fact, measurements on days 0, 7 and 14 contributed 36/76 (47.4%), 29/76 (38.1%) and 11/76 (14.5%) test results, respectively, to this analysis. SFC levels after a first CMV reactivation were compared between patients who experienced no further CMV reac- tivation and those with one or two subsequent (i.e., recur- rent) CMV reactivations. A significant difference in SFC distribution was observed between the two groups, for both IE-1- and pp65-specific SFC levels, when considering all patients (Mann-Whitney U test, P<0.001). The median SFC was, respectively, 10- and 40-times higher in patients free from recurrent CMV reactivation (based on squared mean of square-root-transformed [SRM^2] values) (Figure 2B). In the high-risk population, a significant difference was observed for pp65-induced response (Mann-Whitney U test, P=0.001), but not for IE-1-mediated response (Mann-Whitney U test, P=0.724) which was very low in both groups (Figure 2B). In accordance with these results, a ROC analysis in D-/R+ patients revealed AUC estimates significant for pp65-specific tests (AUC 0.780, 95% confi- dence interval [95% CI]: 0.642-0.917]; P<0.001) but not for IE-1-specific tests (Figure 2C).
Interestingly, a post-hoc analysis of these data upon nor- malization of SFC values to absolute lymphocyte counts derived from peripheral blood counts (expressed as SFC/mL blood) showed a stronger discrimination of SFC distributions between patients without and with recur- rent CMV reactivation, including in D-/R+ patients (Mann-Whitney U test, P=0.010 [IE-1] and P<0.001 [pp65]), and an improved predictive value in ROC analy- sis (AUC 0.760 [95% CI: 0.599-0.921], P=0.002 for IE-1 and AUC 0.863 [95% CI: 0.741-0.986], P<0.001 for pp65) (Online Supplementary Figure S5), compared to the normal- ization to 200,000 lymphocytes. SFC distributions according to conditioning regimen and GvHD occurrence
are presented in Online Supplementary Figures S6 and S7, respectively.
The diagnostic accuracy of the ELISpot assay was determined in terms of sensitivity (patients with recur- rent CMV reactivation had a negative test result after a first CMV reactivation) and specificity (patients free from recurrent CMV reactivation had a positive test result after a first CMV reactivation) (Table 3). Likely due to the low SFC levels and high proportion of negative test results induced by IE-1, the IE-1-specific test alone showed lim- ited performance in the D-/R+ population (Table 3). By contrast, the performance of pp65-specific positive tests, alone or in combination with IE-1, to correctly identify patients free of future recurrent CMV reactivation was high, with a specificity of 77.8% (pp65) and 83.3% (pp65 and IE-1 combined) in D-/R+ patients (Table 3). The sen- sitivity of pp65-specific tests, alone or in combination with IE-1, in D-/R+ patients was 58.6% and 55.2%, respectively (Table 3). The positive predictive value (PPV; patients with a negative test after the first CMV reactiva- tion had a subsequent recurrent CMV reactivation) of pp65-specific tests in D-/R+ patients reached 80.9% (pp65 test alone) and 84.2% (pp65 and IE-1 tests com- bined) while the respective negative predictive values (NPV; patients with a positive test after the first CMV reactivation did not have a subsequent CMV reactivation) were low (53.8% and 53.6%, respectively) (Table 3).
The probability of recurrent CMV reactivation in patients with positive and negative ELISpot tests was estimated using Kaplan-Meier curves (Figure 2D). In line with the previous observations, the difference in proba- bility of recurrent CMV reactivation between patients with a positive or negative pp65-specific test result after the first reactivation was highly significant, both in the total population (HR 4.91; log-rank test, P<0.001) and in the D-/R+ group (HR 2.52; log-rank test, P=0.013) (Figure
366
haematologica | 2021; 106(2)
