
Page 319 - 2021_02-Haematologica-web
P. 319
Letters to the Editor
BDF
CEG
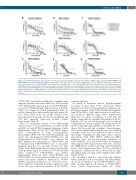
Figure 2 (continued from previous page). Top hits of the drug screening and validation of the most promising candidate drugs on primary NUP98-KDM5A+ and NUP98-NSD1- acute myeloid leukemia samples. (A) Heatmaps of the most effective hits from the drug library screens at 10 nM, 100 nM and 1,000 nM on pri- mary samples from a case of NUP98-KDM5A+ acute myeloid leukemia (AML) and a case of NUP98-NSD1+ AML, ranked by difference in cell viability. Drugs occur- ring multiple times in the heatmap indicate that the drug was present in multiple screened drug libraries. (B-G) Dose-response curves of the selected candidate drugs on primary NUP98-KDM5A+ (n=2) and NUP98-NSD1+ (n=3) AML samples to the tubulin inhibitors vincristine (top) and fosbretabulin (bottom) (B), the PI3K inhibitor omipalisib (C), the MEK inhibitor trametinib (D), the BRD4 inhibitors OTX-015 (top) and ARV825 (bottom) (E), the CDK9 inhibitors dinaciclib (top) and CDKI-73 (bottom) (F), and the HSP90 inhibitor ganetespib (G). Data are based on a 4-day MTT assay and normalized to values in controls treated with dimethyl- sulfoxide.
NUP98-NSD1 was further underlined by comparing gene expression profiles with other AML cases. This revealed 2,176 differentially expressed genes in NUP98-KDM5A+ cases and 2,980 differentially expressed genes in NUP98- NSD1+ cases (Figure 1F, Online Supplementary Tables S3 and S4). Among these differentially expressed genes, 810 were shared between the two groups: 68 genes were upregulated in both groups, 48 were downregulated and 694 had opposing expression profiles (Online Supplementary Table S5).
Gene set enrichment analysis of the differentially expressed genes revealed upregulation of targets of E2F and FLT3 in both NUP98-rearranged subgroups (Online Supplementary Tables S6-S9). TP53 and HDAC targets were downregulated in both rearrangements. Interestingly, STAT5, NF1 and NOTCH1 pathways and targets were upregulated in NUP98-KDM5A cases and downregulated in NUP98-NSD1 cases, whereas the MYC pathway was upregulated in NUP98-NSD1 and downregulated in NUP98-KDM5A cases. Connectivity mapping using the 90th percentile absolute log fold- change of the differentially expressed genes indicated dif- ferent potential targets for treatment of NUP98-KDM5A when compared to NUP98-NSD1 cases (Online Supplementary Figure S3). Both NUP98-KDM5A and NUP98-NSD1 cases had negative median tau scores for histone deacetylase inhibitors. Furthermore, NUP98- KDM5A cases had a median tau score of -21.4 for micro- tubule inhibitors, indicating that these inhibitors could reverse the gene expression signature of the NUP98-
rearranged patients.
In search of treatment options, high-throughput
screening of more than 4,000 compounds (Online Supplementary Table S10) was performed on primary sam- ples from a patient with NUP98-KDM5A+ and a patient with NUP98-NSD1+ AML, and revealed an overall resist- ance profile to different drugs (Online Supplementary Figure S4). At a drug concentration of 1,000 nM, 146 unique compounds were identified that inhibited cell via- bility by >70% in one or both samples. At 100 nM, 41 compounds were found to inhibit cell viability by >60%, and at 10 nM eight drugs inhibited cell viability by >50% (Figure 2A). Etoposide and cytarabine, chemotherapeu- tics used in standard AML treatment, were not identified astophitsatthedosesof10nMand100nM.Atotalof nine drugs, comprising six drug target classes, namely microtubule, PI3K, MEK, HSP90, CDK9 and BRD4 inhibitors, were selected for further validation on NUP98-KDM5A+ (n=2) and NUP98-NSD1+ (n=3) primary AML samples (Online Supplementary Table S11), as well as the CHRF-288-11 cell line harboring a NUP98-KDM5A fusion (Online Supplementary Figure S5). These validation experiments confirmed the effects observed in the high- throughput drug screening (Online Supplementary Figure S2B-G and S6).
In concordance with the connectivity map analysis, tubulin inhibitors such as vincristine and fosbretabulin, decreased cell viability in vitro in NUP98-KDM5A+ cases, while showing limited cell toxicity in NUP98-NSD1+ cases (Online Supplementary Figure S7, Online
haematologica | 2021; 106(2)
633
