
Page 314 - 2021_02-Haematologica-web
P. 314
Letters to the Editor
ABC
DE
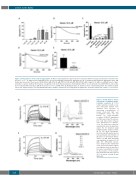
Figure 2. Hemin induces mouse platelet aggregation. (A) Mouse washed platelets (2x10⁸/mL) were incubated with increasing concentrations of hemin in the presence of Ca2+ (2 mM). Platelet aggregation was assessed using light transmission aggregometry. (B, C) Hemin-mediated platelet aggregation (12.5 mM hemin) was assessed in the presence of Ibrutinib (2 mM), PP2 (20 mM), PRT-060318 (20 mM), TAK-242 (10 μM), Cangrelor (10 mM), recombinant mouse C-type- lectin-like receptor-2 (CLEC-2) (Fc-mCLEC-2, 10 mg/mL) (n=4). (D, E) Washed platelets from wild-type (WT) or Clec-2 deficient (Clec-1bfl/fl PF4cre, Clec-2 KO) were incubated with hemin (12.5 mM) in the presence of Ca2+ (2 mM) (n=5). (E) Histogram data are shown as mean ± standard deviation. The statistical signif- icance was analyzed using a one-way ANOVA with Tukey’s multiple comparisons test using Prism 8. Significance is shown compared to control ****P<0.0001.
AB
Figure 3. Hemin binds to mouse and human recombinant C-type- lectin-like receptor-2. (A, C) For surface plasma resonance, real- time interaction profiles were obtained after injection of increasing concentrations of hemin (19.5–625 nM) over recombinant mouse (A) and
CD
human (C)
receptor-2 (CLEC-2) immobilized on CM5 sensor chip. The associa- tion and dissociation phases were followed for 5 minutes, each. The black lines show the experimental data, the grey lines depict the fit obtained using Langmuir global analyses model. (B, D) For UV-vis absorbance spectroscopy, differential spectra were generated after titration of (B) mouse or (D) human dimeric CLEC-2 (2 μM) with increasing concentrations of hemin (0.5–16 mM). The differential spectra were obtained after subtraction of the spectra of hemin at a given concentration from the spectra of the same concentration of hemin in the presence of the protein. The measurements were done at 25°C in optical cell with 10 mm light path.
C-type-lectin-like
628
haematologica | 2021; 106(2)
