
Page 288 - 2021_02-Haematologica-web
P. 288
Letters to the Editor
AB
CD
E
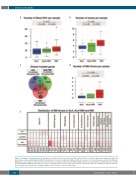
Figure 1. Profiling of somatic variants. (A) Distribution of numbers of filtered single nucleotide variants (SNV) per sample in light-chain amyloidosis (ALA), ALA plus multiple myeloma (ALA+MM) and MM. (B) Distribution of subclones in ALA, ALA+MM and MM. (C) Overlap of sets of mutated genes in ALA, ALA+MM and MM (large circles); numbers of genes mutated in more than two samples within ALA, ALA+MM and MM (small circles). (D) Distribution of MM drivers per sample in ALA, ALA+MM and MM. (E) Heat-map of occurrence of mutated drives in each cohort. Cohort sizes are given in brackets. The assignment of drivers into func- tional categories was performed according to Walker et al.8; ST kinase: serine/threonin kinase.
602
haematologica | 2021; 106(2)
