
Page 267 - 2021_02-Haematologica-web
P. 267
Letters to the Editor
ABCDE
FG
H IKM
JLN
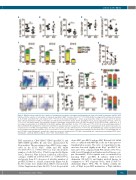
Figure 1. Wip1 knockout resulted in the reduction of hematopoietic progenitor cell number and hematopoietic stem cell activity in embryonic day 12.5-14.5 fetal liver. (A) The reduction of cell number on embryonic day (E)12.5 Wip1-/- fetal liver (FL) (n=9, **P=0.0028). (B-E) Percentages (B, D) and absolute numbers (C, E) of CD45+ and CD34+c-Kit+ cells on E12.5 (n=6, *P<0.05). (F, G) Colony-forming unit – culture assay showed the number of colonies per FL (F) and per 2x10⁴ cells (G) from E12.5 to E14.5. Colony types are indicated by colored bars. E12.5, E13.5, and E14.5: n=3, 3, and 2, respectively; *P<0.05, **P<0.01, ***P<0.001. (H) Representative flow cytometric analysis of phenotypic hematopoietic stem cells (HSC) (Lin–Mac-1lowSca-1+CD150+CD48–, SLAM HSC). (I, J) Percentage (I) and number (J) of SLAM HSC in the E12.5 wild-type (WT) and Wip1-/- FL (n=6, *P=0.0189 and **P=0.0017). (K, L) Reconstituting potential of E12.5 and E14.5 WT and Wip1-/- FL. Chimerism (%CD45.2+) in peripheral blood of recipients at 16 weeks after transplantation. Each symbol represents one recipient. Green circle=WT, red triangle=Wip1-/-. The lines represent the average chimerism (n=3, ***P<0.001. (M, N) Multilineage output of peripheral blood of representative repopulated recipients. (n=3, *P=0.02 and ***P<0.001). ee: embryo equivalent; WT: wild-type; KO: knockout; CFU-C: colony-forming unit cul- ture; CFU-Mix: colony-forming unit – granulocyte, erythrocyte, monocyte, megakaryocyte; CFU-GM: colony-forming unit – granulocyte-macrophage; BFU-E: burst- forming unit – erythroid; GM: Gr-1+/Mac-1+ cells; T: CD3+ cells; B: B220+ cells.
HSC maturation. CD31+CD41lowCD45– (pre-HSC I) and CD31+CD45+ (pre-HSC II) cells were characterized by flow analysis. The percentages of pre-HSC I were compa- rable in the E11.5 Wip1-/- AGM and WT AGM (0.116±0.030% vs. 0.079±0.009%) as were the absolute number of cells (207±44 vs. 176±22, respectively) (Figure 3A-C). However, Wip1 deletion resulted in reduced per- centages of HSC II (0.037±0.004% vs. 0.054±0.006%) and greater than 40% decreases of absolute numbers of pre-HSC II (68±9 vs. 121±15, respectively) (Figure 3A, D, E). The trends were similar when CD201 was included (Online Supplementary Figure S4A-D). To test the potential
of pre-HSC, pre-HSC I and pre-HSC II from E11.5 AGM were co-cultured with OP9-DL1 cells for 6 days prior to transplantation assays. The ratio of repopulated recipi- ents was decreased slightly in the Wip1-/- pre-HSC I cul- tures (2/6; 33%) compared with WT cultures (3/4; 75%), with lower B lymphoid and higher myeloid lineage out- put. Meanwhile, 5/16 recipients were reconstituted by injecting Wip1-/- pre-HSC II cultures with lower chimerism (14.3±5.6%) and higher myeloid lineage in comparison to WT recipients (6/12, with 27.6±8.7% chimerism) (Figure 3F-G, J-K). To further confirm the roles of Wip1 in pre-HSC maturation, a Wip1 inhibitor
haematologica | 2021; 106(2)
581
