
Page 165 - 2021_02-Haematologica-web
P. 165
Coup-TFII activates γ-globin
tial increase of β versus γ levels resulted in an increase in the β/(γ+β) ratio from about 20% in cells transduced with the empty vector (EV cells) to about 30% in KO cells; this is in clear contrast to the decrease in the β/(γ+β) ratio from about 20% in EV cells to about 8% in OE cells (Figure 3B, right panel). This result was confirmed at the protein level (Online Supplementary Figure S6).
also in KO cells (Figure 4A). Almost 100% of the remain- ing 1,783 immunoprecipitated regions mapped to an asso- ciated gene and showed a peak distribution profile within -500 and +500 kb relative to the transcription start site (Online Supplementary Figure S7). Interestingly, Gene Ontology analysis of mouse phenotypes of genes associ- ated with Coup-TFII peaks clearly pointed to hematologic diseases and in particular to erythroid diseases (shaded in pink in Figure 4B). The MEME algorithm27 for enriched motifs discovery identified the canonical (GGTCA) nuclear receptor DNA binding consensus and the GATA- family (GATAA) consensus as the most represented sequences centered under the Coup-TFII peaks (Figure 4C, D). About 39% of sequences bound by Coup-TFII, also contain the GATA consensus, suggesting that Coup-TFII does indeed participate in the regulation of the erythroid- specific genetic program.33
Identification of Coup-TFII in vivo binding sites by chromatin immunoprecipitation sequencing analysis
To elucidate whether Coup-TFII binds directly to the β- locus in vivo and to identify other high-confidence relevant Coup-TFII genomic target regions in β-K562 cells, we designed a stringent chromatin immunoprecipitation (ChIP)-sequencing experiment. We selected Coup-TFII peaks common to the OE and not transduced (NT) cells, from which we subtracted the background peaks present
D
A
BC
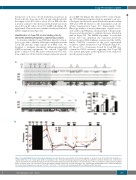
Figure 5. Coup-TFII binds in vivo to the human β-globin locus. (A) Schematic representation of the human β-globin locus. (B) Close-up of the HS2, HS3 and HS4 core regions within the locus control region (LCR). (C) Validation of the chromatin immunoprecipitation-sequencing sites within the LCR. (D) Chromosome conformation capture experiment on Coup-TFII-overexpressed (red), not transduced (black) and -knockout (blue) cells. The structure of the locus with the relative positions of globin genes are shown at the top of the Figure. The anchor region is shown in black; the positions and sizes of the analyzed interacting fragments are shaded in light gray. (n=3; error bars: standard error of mean; *P<0.05; **P<0.01; ***P<0.001). OE: overexpressed; NT: not transduced; KO: knockout.
haematologica | 2021; 106(2)
479
