
Page 195 - 2020_11-Haematologica-web
P. 195
Letters to the Editor
2.0-4.3 years after 2009) when standardized definitions for chronic and persistent ITP were published.4 Importantly, the higher frequency of bleeding document- ed as the response category decreases (Figure 2), suggest- ing that the classification used in this study approximates clinically relevant outcomes.
Refractoriness was 1.7% (4 of 239) among all children and 2.6% (4 of 152) in children with ≥1 year of follow- up. These estimates of refractoriness are slightly lower than those for adult patients,5 as we did not take into account administration of platelet-enhancing therapy on follow-up since administration of platelet-enhancing
therapy at the time of each platelet count was not report- ed in the Registry.
Results of simple logistic regression are shown in Table 1. In multivariable analysis, both age at the time of sur- gery and average platelet count on the first 30 days post- splenectomy predicted CR/R. For every year increase in age at the time of surgery, the odds of CR/R increased by 1.18 (95%CI: 1.02-1.40) and for every 10x109/L increase in the average platelet count in the first month, the odds of response increased by 1.09 (95%CI: 1.05-1.16). In terms of model performance, the optimism-corrected area under the ROC curve was estimated as 0.87.
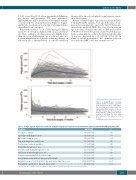
Figure 1. Spaghetti plot showing platelet counts over time. Spaghetti plots of platelet count for each individ- ual over time after splenectomy. The upper panel shows platelet counts in the first 30 days and the lower panel shows platelet counts in the first 50 months of follow-up. The blue solid line represents the regression line (loess).
Table 1. Simple logistic regression results for complete response or response to splenectomy in primary immune thrombocytopenia (ITP).
Predictor
Sex (male vs. female)
Age at time of ITP diagnosis, years
Age at time of surgery, years
Time from diagnosis to surgery, years
N. of previous treatment modalities
Second-line therapy (yes vs. no)
Steroids as part of initial therapy (yes vs. no)
IVIG as part of initial therapy (yes vs. no)
Platelet count immediately before splenectomy*
Average platelet count in first 30 days post-splenectomy*
Any platelet count <100x109/L in first 30 days post-splenectomy (no vs. yes) Peak platelet count in first 30 days post-splenectomy*
OR (95%CI) P
0.94 (0.30-3.05) 0.92
1.12 (0.99-1.29) 0.09 1.15 (1.01-1.33) 0.04 1.05 (0.86-1.41) 0.71 0.70 (0.41-1.24) 0.21 0.30 (0.09-0.97) 0.04 1.02 (0.05-5.83) 0.99 0.59 (0.03-3.25) 0.99 1.01 (1.01-1.03) 0.01
1.09 (1.04-1.15)
26.32 (6.62-176.30)
1.03 (1.01-1.06)
<0.001 <0.001 0.009
OR: odds ratio; CI: confidence interval; N: number; IVIG: intravenous immunoglobulin. *For every 10x109/L increase.
haematologica | 2020; 105(11)
2683
