
Page 146 - 2020_11-Haematologica-web
P. 146
K. Sakai et al.
VWF A1 domain binding site of caplacizumab
We performed SPR analysis to investigate the VWF A1 domain binding site of caplacizumab. After immobilizing caplacizumab on the sensor chip CM5, 16 alanine-substi- tuted mutants of VWF A1 were analyzed (Figure 5). The relative binding amount of WT was defined as 100%. The binding amount of each mutant was expressed as the relative ratio compared to that of WT. When a relative ratio of 80% was set as the cut-off, five mutants were judged as positive. These results indicate that these five residues (K1362, R1392, R1395, R1399, and K1406) are likely the binding sites of caplacizumab.
Comparison of VWF A1 domain binding sites of TAGX-0004, ARC1779, and caplacizumab
Figure 6 shows 3D structure models of the VWF A1 domain. The amino acid residues shown in red indicate the essential residues for binding to each aptamer or capla-
cizumab. The residues shown in yellow are not involved in binding. Of the 16 alanine-substituted VWF A1 mutants, EMSA predicted that three amino acids (F1366, R1395, and R1399) are binding sites for TAGX-0004, as shown in red in Figure 6 on the left. The remaining 13 amino acid residues are shown in yellow. As for ARC1779, five amino acid residues (R1287, K1362, R1392, R1395, and R1399) play an important role in binding to VWF A1, as shown in red in Figure 6 in the middle. Of these, R1395 and R1399 are amino acids shared by both aptamers. Further, using Biacore we identified five amino acid residues in the VWF A1 domain (K1362, R1392, R1395, R1399, and K1406) that are binding sites to capla- cizumab, as shown in red in Figure 6 on the right. Of these, K1406 is unique to caplacizumab. The differences in VWF A1 domain binding sites suggest that these aptamers or nanobody might have unique effects on platelet aggregation and thrombosis formation.
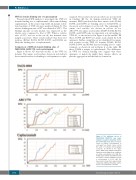
Figure 2. The inhibitory effects of TAGX-0004, ARC1779, and capla- cizumab on platelet thrombus forma- tion under high shear stress. Pressure curves at various concentrations of each agent are shown; curves end at the point of complete microcapillary occlusion. As shown in the upper panel, TAGX-0004 inhibited thrombus formation under high shear conditions at a final concentration of 50 nM. The middle panel shows that ARC1779 did not achieve complete inhibition even at a concentration of 1,000 nM. The lower panel shows that caplacizumab completely inhibited thrombus forma- tion at a concentration of 50 nM.
2634
haematologica | 2020; 105(11)
