
Page 114 - 2020_11-Haematologica-web
P. 114
S. Jaramillo et al.
AB
C
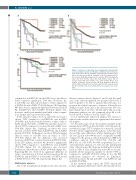
P=0.002
P=0.014
P=0.189
Figure 1. Outcomes of early stage chronic lymphocytic leukemia (CLL) cases according to subset classification. (A) Median time-to-first-treat- ment (TTFT) subset #1: 33.7 months, subset #2: 65.0 months, subset #4: not reached, subset #8: 26.3 months, U-CLL: 52.2 months, M-CLL: not reached. (B) Median progression-free survival (PFS) from diagnosis subset #1: 15.9 months, subset #2: 22.8 months, subset #4: not reached, subset #8: 25.7 months, U-CLL: 28.8 months, M-CLL: 92.6 months. (C) Median overall survival (OS) from diagnosis subset #1: 112.5 months, subset #2: not reached, subset #4: not reached, subset #8: 49.0 months, U-CLL: not reached, M-CLL: not reached; Cum: cumu- lative.
compared to m-IGHV3-21 and m-IGHV cases, but did not reach statistical significance (P=0.161). However, the u-subset #2 cases had a shorter time to event compared to u-IGHV3-21 and u-IGHV (P=0.006) (Figure 3B). Regarding OS, there was no significant difference between m-subset #2, m-IGHV3-21 and m-IGHV (P=0.221) (Figure 3C); however, small event numbers precluded robust compar- isons despite the long observation time.
In the advanced stage cohort, m-subset #2 cases had a shorter TTFT compared to m-IGHV3-21 and m-IGHV (P=0.056), and showed similar behavior to that of the u- IGHV group (P=0.215). u-IGHV3-21 patients showed a shorter TTFT compared to u-subset #2 and u-IGHV cases (P=0.050) (Figure 4A). Similarly, m-subset #2 cases showed a shorter TTNT than m-IGHV3-21 and m-IGHV patients (P=0.001). Furthermore, m-subset #2 had a similar clinical course to u-IGHV cases in terms of TTFT (P=0.401) (Figure 4B). No difference was observed between u-IGHV3-21, u-subset #2 and u-IGHV (P=0.536). In the PFS analysis, m-subset #2 showed a significantly shorter PFS compared to m-IGHV3-21 and m-IGHV (P=0.020) (Figure 4C). No difference was observed between m-subset #2 and u-IGHV (P=0.065) (Figure 4C). Regarding OS, we observed no significant difference in terms of survival rate at 5 years between m-subset #2, m- IGHV3-21 and m-IGHV or u-subset #2, u-IGHV3-21 and u-IGHV (P=0.717, P=0.752, respectively) (Figure 4D).
Multivariate analyses
Due to the resemblance in all clinical outcomes, the sim-
ilarities between subsets (Figures 1 and 2) and the small size of the subset population, we grouped subsets #1, 2 and 8 together to be able to analyze their relevance as a group in the clinical outcomes of interest. Subset #4 was analyzed as part of M-CLL for the same reasons. We com- pared this group of subsets to M-CLL and U-CLL. In a sup- plementary analysis, we also compared subset #2 to sub- sets #1 and 8 as well as to M-CLL and U-CLL.
A Cox multivariate regression analysis was chosen to adjust for the variables that were significant in the univari- ate analysis.
For the early stage cohort, the variables included in the final model for TTFT are listed in Table 3. M-CLL and sub- set #4 had a longer TTFT compared to subsets #1, 2 and 8 (P<0.01). In the supplementary analysis, subset #2 alone showed the same differences (Online Supplementary Table S3). M-CLL and subset #4 had also a longer PFS and OS compared to the group of subsets (hazard ratio [HR]:0.44, confidence interval [CI]: 0.272-0.712, P=0.001 and HR:0.431, CI: 0.19-0.978, P<0.044, respectively). In a sec- ond multivariate analysis, we tested for the independent value of the m-subset #2 subgroup, including the variables listed in Table 4. This identified m-subset #2 as an inde- pendent adverse prognostic marker for shorter TTFT as compared to m-IGHV (P<0.001) (Table 4). For the PFS multivariate analysis, we observed no differences between m-subset #2 and m-IGHV or m-IGHV3-21 and m-IGHV (P=0.556).
In the advanced stage cohort, the TTNT final model found a significant difference between M-CLL and subsets
2602
haematologica | 2020; 105(11)
