
Page 97 - 2020_09-Haematologica-web
P. 97
SETDB1 expression suppresses MLL-fusion driven AML
AB
C TOGA Overall Survival vs. Expression D E of H3K9 methyltransferases
P value (n=170)
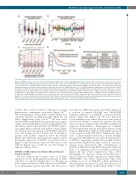
Figure 1. SETDB1 expression is low in acute myeloid leukemia (AML) and correlated with AML patient survival. (A) BloodPool microarray gene expression data mined from Bloodspot shows AML patient gene expression relative to the nearest normal hematopoietic counterpart for the indicated genes encoding H3K9 methyltrans- ferases (n=1991) in a violin plot. Max probe was used for all genes. (B) BloodPool data for AML patients’ SETDB1 expression relative to nearest normal counterpart divided by karyotype (n=1,991) shown in a boxplot. Max probe was used for SETDB1 expression. (C) TCGA RNA-seq patient sample data is divided by “high” expres- sion (above median) and “low” expression (below median) for the indicated gene encoding an H3K9 methyltransferase. Boxplot shows overall survival for each strat- ified gene (n=173). (D) Kaplan Meier curve showing overall survival of AML patients stratified by SETDB1 expression above (“high”) or below (“low”) median (n=173). (E) Multivariate analysis using Cox Hazard Proportion analysis to assess the hazard ratio associated with changing levels of SETDB1 expression. SETDB1 expression is expressed in log2 (RSEM), so the hazard ratio is associated with a two-fold change in SETDB1 expression. Age did not satisfy the model and was stratified by patients <60 years old and patients >60 years old (n=173). Statistics: log-rank followed by multiple testing correction using Benjamani-Hochberg false discovery rate (FDR) (C); log-rank (D); Cox Proportional Hazard Model (E); n: biological replicates; *: P/padj<0.05; RNA-seq: RNA sequencing.
are 66%, 56%, and 41% relative to their nearest normal hematopoietic counterparts, respectively (Figure 1A).25,26 The downregulation of these genes in AML samples was consistent regardless of AML karyotype (Figure 1B and Online Supplementary Figure S1A-B).25,26 We next tested whether H3K9 methyltransferase gene expression signifi- cantly correlated with patient survival using publicly avail- able RNA-seq data2 and found that only SETDB1 expres- sion significantly correlated with patient survival (Figure 1C). Median survival for patients with SETDB1 expression above the median was 26.3 months and 9.5 months in patients with SETDB1 expression below the median (Figure 1D).2 Univariate and multivariate analyses reveal that higher expression of SETDB1 is associated with a higher overall survival rate with a P<0.003 and a lower expected hazard ratio of 0.29 per two-fold change in expression (Figure 1D-E).2
SETDB1 or G9A expression reduces AML growth and colony formation
We next explored the biological effects of SETDB1 expression on the transformation and growth of AML cells. First, we explored whether there is a difference in Setdb1 expression in mouse AML relative to normal HSPC by isolating lineage negative (Lin–) cKit+ cells from mouse
bone marrow. qPCR demonstrates that Setdb1 expression is reduced in murine MLL-AF9 and CALM-AF10 leukemias compared to normal HSPC, consistent with the patient sample data (Figure 2A). We next performed colony replating assays where Lin– mouse bone marrow cells were retrovirally co-transduced with the MLL-AF9 fusion oncogene with and without SETDB1 and plated in semi-solid methylcellulose. Overexpression of human SETDB1 significantly reduced MLL-AF9 mediated colony formation (Figure 2B-C) while not affecting the expression of the exogenous MLL-AF9 (Online Supplementary Figure S2A).24 Colony formation driven by a separate leukemic fusion protein, E2A-HLF, was also reduced in the presence of SETDB1, suggesting a general effect on AML transfor- mation (Online Supplementary Figure S2B-C). Ex vivo prolif- eration assays demonstrate that overexpression of SETDB1 in MLL-AF9 or E2A-HLF transformed AML cells leads to a significant reduction in cellular proliferation (Figure 2D and Online Supplementary Figure S2D). Interestingly, we observed a strong selective pressure to reduce exogenous SETDB1 expression in cultured MLL- AF9+SETDB1 cells (Online Supplementary Figure S2E) resulting in rescue of MLL-AF9 cellular proliferation (Online Supplementary Figure S2F). MLL-AF9 cells that over- express SETDB1 undergo morphological changes consis-
haematologica | 2020; 105(9)
2275
