
Page 89 - 2020_09-Haematologica-web
P. 89
Ruxolitinib and interferon-a for PV and MF
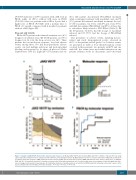
(P=0.003). Likewise, 14 (93%) patients with a MR were in PBCR, while 12 (50%) without MR were in PBCR (P=0.014). Moreover, patients with a MR at 2 years had a higher rate of PBCR (P=0.025) with a median time to PBCR of 1 month, compared with 6 months for patients without a MR (Figure 2D).
Drop-out and toxicity
Of the 32 PV patients who initiated treatment, two (6%) dropped out within 2 years. Of 18 MF patients, six (33%) dropped out. In total, the drop-out rate was 16%. Three patients had an inadequate response; four had adverse events; among these, two had neuropsychiatric adverse events, one had multiple infections and gastrointestinal bleeding and requested to be taken off protocol (Online Supplementary Table S2). Eight (25%) PV patients and one
(6%) MF patient discontinued PEG-IFNa2 treatment while continuing treatment with ruxolitinib, and one PV (3%) patient discontinued ruxolitinib treatment. In total, 17 (34%) patients, ten (31%) with PV and seven (39%) with MF, discontinued PEG-IFNa2; ten (59%) of these due to side-effects likely related to PEG-IFNa2 (Table 2). Of the 50 patients, 32 (64%) had the dosage of ruxolitinib reduced, and 35 (70%) had the dosage of PEG-IFNa2 reduced.
The prevalence of adverse events, including disease- related and study drug-unrelated events, observed in ≥10% of the patients and all grade 3 or 4 adverse events, are presented in Table 2. Four thromboembolic events occurred in three patients, two patients with PV and one with MF: the events were myocardial infarction in one patient, ischemic stroke in one patient, and both retinal
AB
CD
Figure 3. Change in JAK2-V617F allele burden and molecular response. (A) Median JAK2 V617F allele burden (JAK2) with 95% confidence interval (95% CI), using a generalized linear mixed model to compare baseline with time points during treatment. (B) Waterfall plot over the best relative reduction in JAK2 with an indication of complete molecular response (CMR), partial molecular response (PMR), and no molecular response (NMR) with baseline value below or above 20%. (C) Median JAK2 and 95% CI in patients in partial or complete remission after 24 months and patients not in remission with stars representing a statistically significant differ- ence in change from baseline between groups. (D) Cumulative incidence of peripheral blood cell remission (PBCR) in patients achieving a molecular response after 2 years and patients not achieving a molecular response. *P<0.05; **P<0.01; ***P<0.001
haematologica | 2020; 105(9)
2267
