
Page 269 - Haematologica - Vol. 105 n. 6 - June 2020
P. 269
Allogeneic transplantation for CBF AML
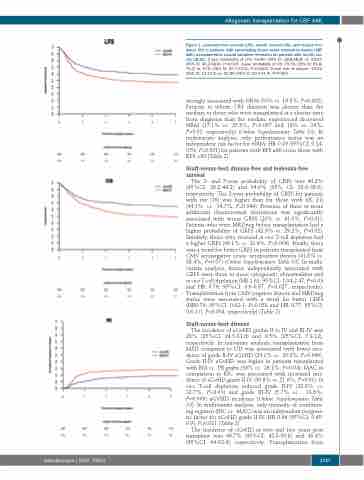
Figure 1. Leukemia-free survival (LFS), overall survival (OS), and relapse inci- dence (RI) in patients with core-binding factor acute myeloid leukemia (CBF AML) transplanted in second complete remission for patients with inv(16) ver- sus t(8;21). 2-year probability of LFS: 63.8% (95% CI: 58.8-68.8) vs. 52.5% (95% CI: 46.2-58.8), P=0.003. 2-year probability of OS: 70.5% (95% CI: 65.8- 75.3) vs. 57% (95% CI: 50.7-63.2), P=0.0003. 2-year risk of relapse: 15.6% (95% CI: 12-19.6) vs. 25.8% (95% CI: 20.5-31.4), P=0.009.
strongly associated with NRM (50% vs. 19.8%, P=0.002). Patients in whom CR1 duration was shorter than the median, or those who were transplanted at a shorter time from diagnosis than the median, experienced decreased NRM (17.1% vs. 25.8%, P=0.007 and 18% vs. 24%, P=0.01, respectively) (Online Supplementary Table S3). In multivariate analysis, only performance status was an independent risk factor for NRM; HR 0.29 (95%CI: 0.14- 0.59, P=0.001) for patients with KPS ≥80 versus those with KPS <80 (Table 2).
Graft-versus-host disease-free and leukemia-free survival
The 2- and 5-year probability of GRFS was 40.2% (95%CI: 36.2-44.2) and 34.6% (95% CI: 30.6-38.6), respectively. The 2-year probability of GRFS for patients with inv (16) was higher than for those with t(8; 21) (44.1% vs. 34.7%, P=0.049). Presence of three or more additional chromosomal aberrations was significantly associated with worse GRFS (20% vs. 41.3%, P=0.01). Patients who were MRDneg before transplantation had a higher probability of GRFS (42.9% vs. 29.2%, P=0.02). Similarly, those who received in vivo T-cell depletion had a higher GRFS (46.1% vs. 33.9%, P=0.004). Finally, there was a trend for better GRFS in patients transplanted from CMV seronegative versus seropositive donors (41.8% vs. 38.4%, P=0.07) (Online Supplementary Table S3). In multi- variate analysis, factors independently associated with GRFS were three or more cytogenetic abnormalities and in vivo T-cell depletion (HR 1.61; 95%CI: 1.04-2.47, P=0.03 and HR 0.76; 95%CI: 0.6-0.97, P=0.027, respectively). Transplantation from CMV negative donors and MRDneg status were associated with a trend for better GRFS (HR0.79; 95%CI: 0.62-1, P=0.058 and HR 0.77; 95%CI: 0.6-1.0, P=0.054, respectively) (Table 2).
Graft-versus-host disease
The incidence of aGvHD grades II to IV and III-IV was
28% (95%CI: 24.5-31.6) and 9.5% (95%CI: 7.3-12), respectively. In univariate analysis, transplantation from MSD compared to UD was associated with lower inci- dence of grade II-IV aGvHD (24.1% vs. 30.8%, P=0.049). Grade II-IV aGvHD was higher in patients transplanted with BM vs. PB grafts (36% vs. 26.1%, P=0.04). MAC in comparison to RIC was associated with increased inci- dence of aGvHD grade II-IV (30.8% vs. 21.6%, P=0.01). In vivo T-cell depletion reduced grade II-IV (23.6% vs. 32.7%, P=0.01) and grade III-IV (5.7% vs. 13.6%, P=0.009) aGVHD incidence (Online Supplementary Table S3). In multivariate analysis, only intensity of condition- ing regimen (RIC vs. MAC) was an independent prognos- tic factor for aGvHD grade II-IV: HR 0.64 (95%CI: 0.45- 0.9), P=0.011 (Table 2).
The incidence of cGvHD at two and five years post transplant was 46.7% (95%CI: 42.5-50.8) and 48.4% (95%CI: 44-52.4), respectively. Transplantation from
haematologica | 2020; 105(6)
1727
