
Page 150 - Haematologica May 2020
P. 150
B. Depreter et al.
AB
C
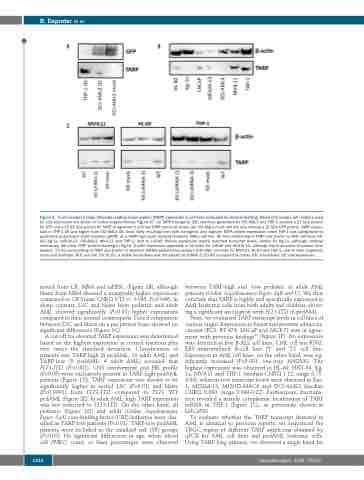
Figure 2. T-cell receptor γ chain alternate reading frame protein (TARP) expression in cell lines evaluated by western blotting. Whole-blot images with ladders used for size estimation are shown in Online Supplementary Figure S7. (A) TARP transgenic (OE) cell lines generated for OCI-AML3 and THP-1 showed a 27 kDa protein for GFP and a 15-25 kDa protein for TARP. In agreement with low TARP transcript levels, the OCI-AML3 mock cell line only showed a 27 kDa GFP protein. TARP expres- sion in THP-1 OE was higher than OCI-AML3 OE, most likely resulting from both transgenic and cognate TARP protein expression, since THP-1 was categorized by qualitative polymerase chain reaction (qPCR) as a TARP-high acute myeloid leukemia (AML) cell line. (B) Immunoblotting of TARP and β-actin in AML cell lines (HL- 60, Kg-1a, MOLM-13, OCI-AML3, MV4;11 and THP-1) next to LNCaP. Protein expression mostly matched transcript levels, except for Kg-1a, although confocal microscopy did allow TARP protein staining in Kg-1a. β-actin expression appeared to be lower for LNCaP and MOLM-13, although equal amounts of protein were loaded. (C) Immunoblotting of TARP and β-actin in selected shRNA-mediated knockdown (KD) AML cell lines for MV4;11, HL-60 and THP-1, next to their respective mock and wild-type (WT) cell line. For HL-60, a stable knockdown was introduced by shRNA 3 (19.4% compared to mock). KD: knockdown; OE: overexpression.
sorted from CB, NBM and mPBSC (Figure 1B), although blasts from NBM showed a marginally higher expression compared to CB (mean CNRQ 0.12 vs. 0.045, P=0.049). In sharp contrast, LSC and blasts from pediatric and adult AML showed significantly (P<0.01) higher expressions compared to their normal counterparts. Paired comparison between LSC and blasts on a per patient basis showed no significant differences (Figure 1C).
A cut-off for elevated TARP expression was determined based on the highest expression in control fractions plus two times the standard deviation. Classification of patients into TARP-high (8 pedAML, 13 adult AML) and TARP-low (5 pedAML, 4 adult AML) revealed that FLT3-ITD (P<0.001), CNS involvement and HR profile (P<0.05) were exclusively present in TARP-high pedAML patients (Figure 1D). TARP expression was shown to be significantly higher in sorted LSC (P<0.01) and blasts (P<0.0001) from FLT3-ITD compared to FLT3 WT pedAML (Figure 2E). In adult AML, high TARP expression was not restricted to FLT3-ITD. On the other hand, all pediatric (Figure 1D) and adult (Online Supplementary Figure S4A) core-binding factor (CBF) leukemia were clas- sified as TARP-low patients (P<0.01). TARP-low pedAML patients were included in the standard risk (SR) groups (P<0.05). No significant differences in age, white blood cell (WBC) count, or blast percentages were observed
between TARP-high and -low pediatric or adult AML patients (Online Supplementary Figure S4B and C). We thus conclude that TARP is highly and specifically expressed in AML leukemic cells from both adults and children, show- ing a significant association with FLT3-ITD in pedAML.
Next, we evaluated TARP transcript levels in cell lines of various origin. Expression in breast and prostate adenocar- cinoma (PC3, BT-474, LNCaP and MCF-7) was in agree- ment with previous findings42 (Figure 1F). No expression was detected in five B-ALL cell lines, CML cell line K562, EBV-immortalized B-cell line JY and T2 cell line. Expression in AML cell lines, on the other hand, was sig- nificantly increased (P<0.001, one-way ANOVA). The highest expression was observed in HL-60, HNT-34, Kg- 1a, MV4;11 and THP-1 (median CNRQ 1.12, range 0.75- 4.84), whereas low transcript levels were observed in Kas- 1, MOLM-13, MONO-MAC6 and OCI-AML3 (median CNRQ 0.080, range 0.049-0.22). Furthermore, fractiona- tion revealed a mainly cytoplasmic localization of TARP mRNA in THP-1 (Figure 1G), as previously shown in LNCaP43.
To evaluate whether the TARP transcript detected in AML is identical to previous reports, we sequenced the TRGC region of different TARP amplicons obtained by qPCR for AML cell lines and pedAML leukemic cells. Using TARP long primers, we observed a single band for
1310
haematologica | 2020; 105(5)
