
Page 136 - Haematologica May 2020
P. 136
A. Sharma et al.
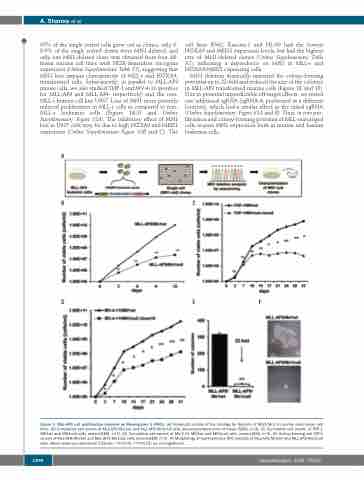
30% of the single sorted cells grew out as clones, only 0- 8.9% of the single sorted clones were MN1-deleted, and only one MN1-deleted clone was obtained from four dif- ferent murine cell lines with HOX-dependent oncogene expression (Online Supplementary Table S2), suggesting that MN1 loss impairs clonogenicity of MLL-r and HOXA9- transformed cells. Subsequently, in parallel to MLL-AF9 mouse cells, we also studied THP-1 and MV-4-11 (positive for MLL-AF9 and MLL-AF4, respectively) and the non- MLL-r human cell line U937. Loss of MN1 more potently reduced proliferation in MLL-r cells as compared to non- MLL-r leukemia cells (Figure 1B-D and Online Supplementary Figure S2A). The inhibitory effect of MN1 loss in U937 cells may be due to high HOXA9 and MEIS1 expression (Online Supplementary Figure S2B and C). The
cell lines K562, Kasumi-1 and HL-60 had the lowest HOXA9 and MEIS1 expression levels, but had the highest rate of MN1-deleted clones (Online Supplementary Table S2), indicating a dependence on MN1 in MLL-r and HOXA9/MEIS1 expressing cells.
MN1 deletion drastically impaired the colony-forming potential up to 22-fold and reduced the size of the colonies in MLL-AF9 transformed murine cells (Figure 1E and 1F). Due to potential unpredictable off-target effects, we tested one additional sgRNA (sgRNA-4; positioned at a different location), which had a similar effect as the initial sgRNA (Online Supplementary Figure S3A and B). Thus, in vitro pro- liferation and colony-forming potential of MLL-rearranged cells require MN1 expression both in murine and human leukemia cells.
A
BC
DEF
Figure 1. MLL-AF9 cell proliferation depends on Meningioma 1 (MN1). (A) Schematic outline of the strategy for deletion of MN1/Mn1 in murine and human cell lines. (B) Cumulative cell counts of MLL-AF9/Mn1wt and MLL-AF9/Mn1null cells [mean±standard error of mean (SEM), n=3]. (C) Cumulative cell counts of THP-1 MN1wt and MN1null cells (mean±SEM, n=3). (D) Cumulative cell counts of MV-4-11 MN1wt and MN1null cells (mean±SEM, n=3). (E) Colony-forming cell (CFC) counts of MLL-AF9/Mn1wt and MLL-AF9/Mn1null cells (mean±SEM, n=3). (F) Morphology of representative CFC colonies of MLL-AF9/Mn1wt and MLL-AF9/Mn1null cells. Black scale bar represents 0.25 mm. *P<0.05; **P<0.01; ns: not significant.
1296
haematologica | 2020; 105(5)
