
Page 200 - 2019_03-Haematologica-web
P. 200
D.P. Hart et al.
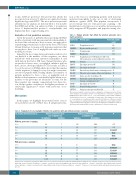
teome, 4,605 are protective. The protein that affords the most protection is factor V, which is recognized as having high homology with FVIII.19 The most protective proteins identified in our analysis are listed in Table 1. It is notable that FVIII and all the top entries in Table 1 (coagulation factor V, hephaestin-like protein 1, ceruloplasmin, and hephaestin) have copper-binding sites.
Evaluation of risk prediction accuracy
Given the paucity of published data specifying the HLA profiles of patients with missense mutation hemophilia A, we based the evaluation of how accurate our approach is at predicting potential risk on data in the Factor VIII Gene Variant Database, focusing on F8 missense mutations that we predict to have low or negligible risk with any com- mon HLA isoform.
Arguably the most important performance indicator for our method is the number of false negatives: are there individuals with missense mutation hemophilia A and with data in the Factor VIII Gene Variant Database who we predict to have a zero, or negligible, inhibitor risk but have, in fact, developed inhibitors? The results in Table 2 for our chosen set of 25 HLA alleles show that the number of false negatives (column 3) is very low with conservative cut-offs for peptide-MHC binding affinity. The number of patients predicted to have a zero, or negligible risk of inhibitor development is considerably higher when cross- matches to the proteome are taken into account, but the false negative rate remains comparatively low; these fac- tors taken together contribute to the higher prevalence of statistically significant P values with proteome cross- matching.
Discussion
In this paper, we highlight the potential value of an in silico predictive model of HLA class II antigen presenta-
tion as the basis for identifying patients with missense mutation hemophilia A who are at risk of developing inhibitors against tFVIII. Our pipeline incorporates a novel strategy that we term proteome scanning – the identification of fortuitous cross-matches between poten- tially antigenic tFVIII peptides and peptides arising else-
Table 1. Human proteins that afford the greatest proteome cross- match protection.
UniProt ID
P12259
Q6MZM0 P00450 Q9BQS7 P00451
O75445 Q14585 Q14587 Q96M86 O00154 Q7LBC6 Q9UKF2
Q9Y2P0 P10745 Q5T5N4
Protein name
Coagulation factor V
Hephaestin-like protein 1
Protected peptide count
640
457
Ceruloplasmin 437
Hephaestin 389
Coagulation factor VIII [match to different,
but homologous, location within the protein] 251
Usherin 150
Zinc finger protein 345 142
Zinc finger protein 268 134
Dynein heavy chain domain-containing protein 83
Cytosolic acyl coenzyme A thioester hydrolase 76
Lysine-specific demethylase 3B 75
Disintegrin and metalloproteinase
domain-containing protein 30 75
Zinc finger protein 835 74
Retinol-binding protein 3 73
Uncharacterized protein C6orf118 67
Table 2. Evaluation of zero/negligible inhibitor risk prediction with and without proteome scanning.
The protected peptide count for a given combination of human protein p, F8 mis- sense mutation m and HLA isoform h is incremented by 1 every time a peptide in tFVIII that spans the location of m is (i) associated with a predicted risk of inhibitor development for h prior to considering cross-matches to the human proteome, and (ii) cross-matches to a peptide in p that is a predicted binder for h. Hence a peptide that cross-matches to multiple binding peptides at different locations within p will be counted multiple times.The final count for p is the aggregate of individual counts for all F8 missense mutation/HLA isoform combinations considered in this study.
IC50 binding threshold (nmol/L) Patients predicted to have zero/negligible risk
No inhibitors Inhibitors
Without proteome scanning
1000 28 1
500 49 3
Patients predicted to have P an inhibitor risk
Inhibitors No inhibitors
116 1344 0.72
92 985 0.62
300 122 200 179 100 362 50 593
With proteome scanning
1000 103
500 157
300 322
200 465
100 777
50 1,114 66
5.84x10⁻⁴ 0.02 0.02 2.01x10³
0.02 4.50x10⁻⁵ 1.14x10⁻⁸ 1.07x10⁻⁸ 6.57x10⁻⁵ 3.72x10⁻⁵
3 9 20 36
84 787 76 660 37 338 31 228
80 622 65 339 57 261 53 232 23 133 22 115
4 7 14 26 42
P values were calculated by applying the Fisher exact test to patients from the Factor VIII Gene Variant Database falling into the following categories: predicted to have zero/neg- ligible risk, observed to have no inhibitors (column 2); predicted to have zero/negligible risk, observed to have inhibitors (column 3); predicted to have inhibitor risk, observed to have inhibitors (column 4); and predicted to have inhibitor risk, observed to have no inhibitors (column 5). P values <0.05 are deemed statistically significant and are shown in bold.
606
haematologica | 2019; 104(3)
