
Page 155 - 2019_03-Haematologica-web
P. 155
Pancreatitis in childhood ALL
pinpointing the association driving the signal is thus of importance in the latter population. Sequencing the PRSS1-PRSS2 risk allele has not revealed disease-associat- ed coding variants accounting for the association with pancreatitis in GWA studies; however, the risk allele (rs4726576; rs10273639) is an expressive quantitative trait
locus for PRSS1 shown to elevate gene expression.30,34 The activation of trypsinogen is mediated by cleavage of the N-terminus extension of cationic trypsinogen (a cal- cium binding site) to active trypsin. Higher levels of calci- um have been shown to lead to trypsin activation, and with higher expression of trypsin as seen in patients with
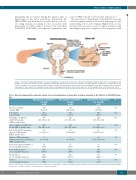
Figure 3. Schematic drawing illustrating the effects of asparaginase on pancreatic acinar cells. Schematic drawing illustrating the likely effect of asparaginase (red triangle) on the protease-activated receptor 2 (PAR2) receptor, and how this leads to increased calcium (Ca++) efflux from the endoplasmic reticulum. This in turn leads to opening of Ca++ release activated (CRAC) channels, further increasing intracellular calcium levels, reducing ATP levels and allowing activation of inactive trypsinogen to active trypsin. The drawing is heavily influenced by diagrams by Peng et al. (Phil Trans Royal Soc, 2015) and Whitcomb et al. (Nature Gen, 2012).
Table 2. Baseline characteristics, pancreatic enzyme levels and complications of pancreatitis in children according to the PRSS1-2 (rs13228878) geno- type.
Homozygote for rs13228878_A risk allele
n=104
7.75 (4–12.06)
53%
(55/104)
397 (263–673; n= 43)
1255
(758–2140; n=39)
10.5 (6–16; n=70)
4 (2–7; n=74)
5% (5/93)
21%
(17/80)
25% (22/89)
Heterozygote for rs13228878_A risk allele
n=109
9.21 (4.46–13.43)
55%
(60/109)
382 (206–671; n=51)
1096
(415–1754; n=48)
10.5 (6–14; n=82)
3 (2–6; n=85)
7% (7/101)
23%
(20/87)
31% (31/100)
Homozygote for rs13228878_G P non- risk allele
n=30
6.22 0.27 (4.9–12.1)
57% 0.92
(17/30)
222 0.33 (151–617; n=14)
867 0.24
(193–2862; n=11)
11 0.96 (8–13.25; n=16)
3.5 0.34 (1.25–6.75; n=18)
0% 0.38 0/26
18% 0.88
(4/22)
8% 0.07 (2/24)
Age (years), median (median; IQR)
Sex, % males
n. males/total))
Total amylase at diagnosis of AAP (U/L) median (IQR; n. available data)
Lipase at diagnosis of AAP (U/L)
median (IQR; n. available data)
Days from last PEG- asparaginase exposure to AAP, median
(IQR; n. available data)
Number of PEG-asparaginase administrations prior to AAP, median (IQR; n. available data)
Assisted mechanical ventilation, % (yes (n.)/available data (n.))
Acute insulin therapy, %
(yes (n.)/available data (n.))
Pseudocysts, %
(yes (n.)/available data (n.))
Death,% 3% 1% 0% 0.38
(yes (n.)/available data (n.)) (3/93) (1/101) (0/27)
Baseline characteristics,pancreatic enzyme levels and complications of pancreatitis according to rs13228878 genotype.Differences among groups were analyzed with the Kruskal-Wallis rank sum test (continuous variables) and chi-square test (categorical variables).
haematologica | 2019; 104(3)
561
