
Page 152 - 2019_03-Haematologica-web
P. 152
B.O. Wolthers et al.
Replication
Three top SNPs were tested for validation in two separate cohorts. The Children’s Oncology Group AALL0232 ALL cohort included previously genotyped data on PRSS1-2 variants (but not on the NFATC2 variant). The NFATC2 variant was genotyped de novo in a cohort of patients from the Dana Farber Cancer Institute (DFCI) ALL Consortium protocols 87−01, 91−01, 95−01 and 00−01 (1987-2004). The AALL0232 ALL cohort included 76 cases diagnosed using National Cancer Institute’s Common Terminology Criteria for Adverse Events (CTCAE criteria) (Online Supplement pages 6−9) and 2577 controls.8 The cohort is described in detail in the appendix.8 The AALL0232 cohort was genotyped on the Affymetrix Genome-Wide Human SNP 6.0 Array, and imputed genotypes were generated using 1000 Genomes as the reference population as reported (ref: PMID 26265699). Time- dependent analysis (Cox proportional hazards regression) was performed adjusting for age and ancestry. The cohort of patients treated on the DFCI ALL Consortium protocols 87−01, 91−01, 95−01 and 00−01 received 20−30 weeks of post-induction asparaginase therapy (Online Supplement pages 9-11). Thirty-three cases diagnosed according to the CTCAE criteria and 285 controls were included in this cohort, and genotyped by allele-specific oligonucleotide hybridization as described elsewhere.18,19 The Pearson correlation coefficient was used to investigate associa- tions between genotype and AAP.
Statistical analysis
Association analysis was done in PLINK using logistic regres- sion, assuming an additive genetic model, and adjusting for genet- ic ancestry and age. Genetic ancestry was determined by cluster- ing analysis, and non-CEU ancestry was defined as individuals >16 standard deviations away from the HapMap-defined CEU (Northern and Western European) centroid mean. Using this model, multidimensional scaling plots showed an equal distribu- tion of cases and controls according to ancestry (Online Supplementary Figure S3) and QQ plots showed no sign of popula- tion substructure (λ = 1.02, Online Supplementary Figure S4). Statistical analysis of phenotype and genotype associations was
performed in the statistical program R version 3.3.3.20 Linear and logistic regression analyses were used to identify associations between genotypes and continuous or categorical clinical variables adjusting for age and ancestry. Genotype was treated as a numer- ical value (0, 1 or 2 minor alleles) for additive effect. The Kaplan- Meier method was used to estimate probability of event-free sur- vival according to genotypes, and differences were compared with the two-sided log-rank test. No prior sample size calculations were applied for pre-study power calculations. Two-sided P-val- ues below 0.05 were regarded as statistically significant. SNPs were annotated to genes 10 kb up- or downstream from transcrip- tion start- and end-sites, respectively, and all SNPs with a P-value below 5 x 10⁻⁵ were manually inspected for associations with genes and pathways previously related to pancreatitis. Investigated SNPs were explored using dbSNP16 and Ensembl,15 linkage disequilibrium (LD) between SNPs by the National Cancer Institute LDassoc tool,21 tissue expression (expressive quantitative trait loci) by GTeX,22 regulatory effect by RegulomeDB,23 and regional association plots were produced by the LocusZoom tool.24 Genes and SNPs previously associated with pancreatitis were investigated by searching PubMed for reports published in English within the last 10 years, using the search terms “pancreati- tis” AND “genome” OR “genetic” OR “genotype” in the title. Gene functions were defined by Genecards25 (www.genecards.org).
Results
After quality control filtering, 244 cases, 1320 controls and 1401908 SNPs were eligible for association analysis. Two hundred and five of the 244 (84%) cases and 1185/1320 (90%) of controls were of European (CEU) ancestry (Online Supplementary Figure S4). The median age (interquartile range, IQR) of the cases was 8.1 years (IQR, 4.3 to 13.1) while that of the controls was 5.0 years (IQR, 3.0 to 9.0). Fifty-five percent of both cases (133/244) and controls (724/1320) were male.
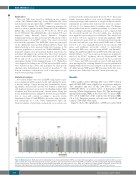
Figure 1 shows the significance of SNPs associated with
Figure 1.Manhattan plot. Manhattan plot showing single nucleotide polymorphisms (SNPs) associated with asparaginase-associated pancreatitis in 244 cases and 1320 controls. The x axis represents genomic location, and the y axis represents the P value for the SNP associations calculated using logistic regression adjusting for age and ancestry. Genes previously associated with pancreatitis are represented in color. SNPs are annotated to genes based on genomic location (10 kb upstream and downstream of the transcription start site and transcription terminator, respectively. The human assembly GRCh37 was used for reference.
558
haematologica | 2019; 104(3)
