


Page 209 - Haematologica Vol. 110 - January 2025
P. 209
LETTER TO THE EDITOR AB
 C
gression analyses, the outcomes showed that only the SUVmax, EBV-DNA, and ctDNA concentration were inde- pendent prognostic factors for OS (Figure 2A). We did not include LDH in construction of the nomogram consider- ing the inconsistent identification of LDH >245 U/L as a risk factor in univariate and multivariate Cox regression analyses. We created a prognostic nomogram, SEC, to predict the 3- and 5-year OS of ENKTL patients based on the SUVmax, ctDNA, and EBV-DNA level (Figure 2B). To clarify the predictive ability of the SEC score, calibra- tion plots were generated, and the results demonstrated satisfactory consistency between the nomogram predic- tion for OS values and the actual observation (Figure 3A, B). Harrell’s C-index of the SEC for PFS and OS prediction were 0.771 (95% CI: 0.710-0.831) and 0.817 (95% CI: 0.768- 0.866), respectively, which were better than those of the IPI, KPI, PINK, PINK-E and PINK-EC (Online Supplementary Table S2). These results suggest that the SEC is a more
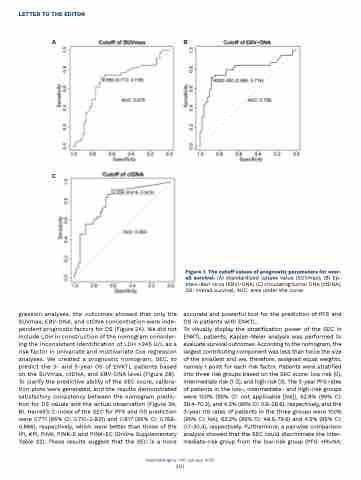
Figure 1. The cutoff values of prognostic parameters for over- all survival. (A) standardized uptake value (SUVmax); (B) Ep- stein-Barr virus (EBV)-DNA; (C) circulating tumor DNA (ctDNA). OS: overall survival; AUC: area under the curve.
accurate and powerful tool for the prediction of PFS and OS in patients with ENKTL.
To visually display the stratification power of the SEC in ENKTL patients, Kaplan-Meier analysis was performed to evaluate survival outcomes. According to the nomogram, the largest contributing component was less than twice the size of the smallest and we, therefore, assigned equal weights, namely 1 point for each risk factor. Patients were stratified into three risk groups based on the SEC score: low risk (0), intermediate risk (1-2), and high risk (3). The 3-year PFS rates of patients in the low-, intermediate- and high-risk groups were 100% (95% CI: not applicable [NA]), 52.6% (95% CI: 39.4-70.3), and 4.2% (95% CI: 0.6-28.6), respectively, and the 3-year OS rates of patients in the three groups were 100% (95% CI: NA), 62.2% (95% CI: 48.6-79.6) and 4.5% (95% CI: 0.7-30.4), respectively. Furthermore, a pairwise comparison analysis showed that the SEC could discriminate the inter- mediate-risk group from the low-risk group (PFS: HR=NA;
Haematologica | 110 January 2025
201


