
Page 182 - Haematologica-5
P. 182
914
C. Perez-Sánchez et al.
A
B
CD
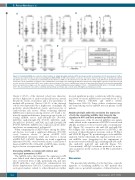
Figure 5. Circulating miRNAs are related to clinical features of antiphospholipid syndrome (APS) and show potential as biomarkers for the development of ather- osclerosis. Association studies of altered circulating microRNA (miRNA or miR) ratios and the occurrence of previous fetal loss (A), the type of thrombosis suffered (B) and the presence of a pathological carotid intima-media thickness (CIMT) (C). Beeswarm plot of each miR ratio is shown, along with mean, Standard Deviation, and P-value. (D) A combination as a panel of the 2 miRNA ratios associated to the pathological CIMT was carried out by using logistic regression on the data set and receiver operator characteristics (ROC) curve analyses were performed. ROC curve of miRNA panel and cut off were generated based on the predicted probability (P) for each patient as a single score. The equation used was: “Combined miRNA-ratio panel [Logit(p)] = 0.599 – 0.133x(miR-19b/miR-124) + 0.007x(miR-124/miR- 296)”. The area under the curve (AUC), sensitivity and specificity are shown, and a cut-off value with higher specificity was selected.
Cluster 2 (17.6% of the clustered cohort) was character- ized by a higher rate of cardiovascular risk factors, arterial thrombotic events, recurrences and a low prevalence of multiple aPL positivity. Cluster 3 (32.4% of the clustered cohort) was represented by a higher rate of multiple aPL positivity, arterial thrombotic events, and lower rate of cardiovascular risk factors. When evaluating different miRNA ratio expression among clusters, we found a sta- tistically significant difference between groups for the fol- lowing miRNA ratios: miR-19b/miR-124 (P<0.001, ANOVA), miR-20a/miR-374 (P<0.05, ANOVA), miR- 20a/miR-210 (P<0.001, ANOVA) and miR-124/miR-296 (P<0.05, ANOVA). miRNA ratio expression in the differ- ent clusters are summarized in Figure 6C.
When comparing the aGAPSS values among the differ- ent clusters, we found a significant difference (P=0.008, t-test) between cluster 1 [mean aGAPSS 5.38; 1.628±Standard Deviation (SD)] and Cluster 2 (mean aGAPSS 8,67; 3.67±SD). Similarly, we found a significant difference (P<0.001, t-test) between cluster 1 and cluster 3 (mean aGAPSS 10.82; 2.316±SD). aGAPSS values stratify- ing for clusters are represented in Figure 6B.
Circulating miRNAs correlate with clinical and serological parameters in APS
The miRNA ratios that integrate the signature in APS were linked with clinical parameters, such as ABI, pres- ence of elevated titers of aPL, particularly aCL and anti- β2GPI antibodies, and erythrocyte sedimentation rate (Online Supplementary Table S3). Correlation analyses with serological markers related to atherothrombosis further
showed significant positive correlations with the expres- sion levels of various miRNA ratios and with levels of TF, PAI-1, VEGF-A, VEGF-R1 and MCP-1 (Online Supplementary Table S3). Some of these correlations were also found among various miRNA ratios in plasma of APS patients.
Antiphospholipid antibodies modulate the expression of both the circulating miRNAs that integrate the signature in APS and their potential protein targets
The expression of the 11 selected miRNAs was signifi- cantly altered in the supernatant of HUVECs treated with aPL-IgG in relation to those treated with a non-immune- IgG (Figure 7A), except for the miR-124 and miR-206. Accordingly, this treatment promoted in HUVECs the secretion of atherothrombotic proteins, such as TF, PAI-1 and VEGF-R1 (Figure 7B), potential targets of the miRNAs analyzed. On the other hand, the expression levels of sev- eral miRNAs were deregulated in the supernatant of monocytes treated with aPL-IgG, including miR-19b, miR- 20a, miR-145, miR-210 and miR-296 (Figure 7C). Concomitantly, aPL-IgG treatment promoted in mono- cytes an increase in the secretion of TF, PAI-1 and MCP-1 (Figure 7D).
Discussion
The present study identifies, for the first time, a specific signature of circulating miRNAs in APS patients that might serve as potential biomarkers of clinical features of
haematologica | 2018; 103(5)
