
Page 154 - Haematologica-5
P. 154
I. Misiewicz-Krzeminska et al.
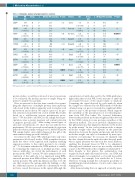
Table 2. Univariate analysis of progression-free survival.
mRNA HR Group (CI)
IKZF3 1.84 H (0.74-4.6) L
CANX1 0.44 H (0.18-1.11) L
n Median PFS (months)
10 21.7
33 45.1
21 50.4
22 23.5
10 50.4 33 29.8
27 29.8
16 NR
17 NR 26 29.8
33 30
10 45.1
29 43.8 14 23.5
24 50.4
19 23.5
25 29.8 18 43.8
18 50.4
25 23.5
28 50.4 15 23.5
11 20.3
32 45.1
P-value
Protein
Aiolos
Calnexin
Cereblon
CyclinD1
CyclinD2
c-myc
Ddx21
Hsp90
Ikaros
Psme1
Ripk1
Xaf1
HR Group n (CI)
0.51 H 33
(0.19-1.34) L 10
1.82 H 22
(0.72-4.6) L 18
0.23 H 31 (0.09-0.55) L 12
1.55 H 23
(0.64-3.78) L 20
0.24 H 11 (0.05-1.03) L 32
0.63 H 27
(0.26-1.56) L 13
0.47 H 14 (0.15-1.46) L 23
1.5 H 12
(0.53-4.27) L 25
0.31 H 32 (0.12-0.77) L 11
0.48 H 30
(0.19-1.26) L 10
1.41 H 11 (0.53-3.73) L 29
1.56 H 15
(0.63-3.85) L 25
P-value 45.1 0.16
23.5
30 0.2
Median PFS (months)
CRBN
CCND1
CCND2
MYC
DDX21
HSP90
IKZF1
PSME1
RIPK1
0.49 H (0.14-1.67) L
2.55 H
(0.91-7.14) L
0.38 H (0.13-1.05) L
1.54 H
(0.51-4.64) L
0.49 H (0.2-1.17) L
0.52 H
(0.22-1.25) L
1.93 H (0.77-4.83) L
0.33 H
(0.12-0.86) L
0.52 H (0.22-1.24) L
0.19
0.074
0.24
0.066
0.053
0.44
0.1
0.14
0.15
0.018
0.13
0.048
43.8
50.4 16.3
0.00034
30 0.33
NR
NR 29.8
0.051
45.1 0.31
29.8
50.4 0.18 30
29.8 0.44
50.4
45.1 17.8
0.0075
XAF1 2.39 H (0.98-5.8) L
45.1 0.13
16.3
30 0.49 45.1
30 0.34
45.1
886
HR: hazard ratio; CI: confidence interval; PFS: progression-free survival; H: high level; L: low level.
protein studies, would have allowed at most six proteins to be evaluated, the median amount of sample being suf- ficient to analyze two proteins.
Here we present for the first time a method for quanti- fying the expression of multiple proteins from myeloma cells stored in the buffer commonly used for nucleic acid preservation and isolation. We report a protocol for pro- tein extraction from MM cells stored in RLT Plus buffer based on a well-known acetone precipitation proce- dure.26,27 We decided to add NaCl to the sample before pre- cipitation, since a greater inorganic salt content is known to improve protein yield.28 After testing several types of salts and concentrations, we chose the one with the best performance. We also assessed several methods of protein pellet dissolution, finally settling for a 0.2 M NaOH and 4x WB sample buffer, since slight changes in the pH of the environment change protein solubility.26,29
In contrast to the classic WB, which provides only semi- quantitative (blot-based) results, CNIA quantifies the area under the curve of the signal in each capillary, enabling expression relative to the control protein to be calculat- ed.3,30 To determine whether the CNIA method is suitable for evaluating the expression of multiple proteins, using various antibodies, we tested the performance of each protein in the WESTM system. We first optimized the con- centration of the antibody to be employed using RIPA- extracted proteins from MM cell lines, as suggested by the system provider. The antibody dilution used has to be the one that saturates the epitope-antibody binding, so that the additional increase in antibody concentration would not have caused the increase in the signal. Although the
concentration of antibodies used by the CNIA platform is higher than that used in WB, lower amounts of antibody are required because of the small volume of antibody. Comparing the signal detected by each antibody when the sample was extracted by the RIPA method with that obtained using our protocol revealed no significant differ- ences for any of the proteins evaluated, which supports the suitability of the present protocol for extracting pro- teins from RLT Plus buffer. We observed differences between the predicted molecular weight and that detected by the CNIA system for some proteins, regardless of the extraction method. The most probable explanation for this phenomenon is that migration depends on the mobil- ity in the matrix.31 In fact, each system provides a unique molecular weight value that depends on the particular interactions between the matrix and protein, and the true molecular weight can only be determined by mass spec- trometry or sequencing.32 In our assay, we analyzed only the data obtained from the antibodies that detected peaks whose signal intensity was linear in the serial dilutions, enabling the frequent biases in WB to be eliminated. Although such standard curves are not usually calculated as part of the WB method, this is highly recommendable.33 Even though, at first glance, the optimization step required for each antibody seems laborious, one CNIA run allows 24 samples to be analyzed, so it would be possible to optimize, for example, four antibodies in 3 hours. Therefore, bearing in mind the subsequent possibility of quantifying protein abundances, it is not such a time-con- suming process.
After demonstrating that our approach accurately quan-
haematologica | 2018; 103(5)
