
Page 128 - Haematologica-5
P. 128
P. Schommers et al.
After two elimination steps, histology [BL: Hazard ratio (HR) 2.60 95% Confidence Interval (95%CI): 0.92 – 7.4, PBL: HR 1.28 95% CI 0.36-4.57, ARL, not further classi- fied: HR 5.08 95% CI 1.13 – 22.90, indicator = DLBCL), stage III or IV according to the Ann Arbor Staging System (HR 4.85 95%CI 1.44 – 16.34), no concomitant cART (HR 4.28 95%CI 1.19 – 15.39) and use of R-CHOP (HR: 7.59 95%CI 1.87 – 30.81) remained in the model (Table 2). A higher IPI was no longer predictive anymore in the multi- variate model.
Table 1. Patients’ characteristics based on their treatment outcome. CR after CR after Progressive
Dose intensity of chemotherapy
Since chemotherapy regimen (R-CHOP or GMALL) seems to be critical for RFS, we investigated how many patients of all aggressive B-NHL had any kind of reduc- tion (either in the number of chemotherapy cycles or in the treatment intensity) or a delay during their treatment. Results of dose intensity analysis are shown in Online Supplementary Table S3. Overall, 32.7% of the patients had a treatment delay, 13.8% had dose reductions, and 16.5% had reduced numbers of chemotherapy cycles
Partial On Treatment No Total first-line further lines disease remission chemotherapy related chemotherapy (N=387)
P
0.104b
0.514a 0.784b
0.903a 0.006b
0.044a 0.190a 0.023
<0.001a
0.420a
<0.001b
chemotherapy chemotherapy
(n=45)
45
44 (98%) 40208
11 (25%) 111
34 (81%) 15 (39%) 8 (21%)
8 (18%) 20 (46%) 16 (36%)
24 (53%) 12 (27%) 7 (16%) 2 (4%) 0.5
(n=22)
44
21 (96%) 7159
8 ((36%) 186
18 (90%) 6 (29%) 2 (11%)
2 (11%) 13 (68%) 4 (21%)
13 (59%) 5 (23%) 3 (14%) 1 (5%) 0.7
(n=15)
50
15 (100%) 11387
4 (29%) 153
10 (83%) 3 (21%) 1 (9%)
5 (39%) 6 (42%) 2 (15%)
7 (47%) 4 (27%) 3 (20%) 1 (7%) 0.1
deaths (n=23)
48
21 (91%) 2390
8 (35%) 157
13 (68%) 6 (21%) 5 (33%)
2 (9%) 11 (50%) 9 (41%)
7 (30%) 9 (39%) 7 (30%) 0 (0%) 0.2
given (n=7)
46
6 (86%) 105000
2 (29%) 58
4 (67%) 1(17%) 0 (0%)
0 (0%) 3 (43%) 4 (57%)
4 (57%) 1 (14%) 2 (29%) 0 (0%) 0
Median age (years)
Male
Median viral load
(copies/mL)
HIV-RNA below limit of detection Median CD4+
T cells (x109/L)
CD20+ lymphoma
BM involvement
CNS involvement
IPI score
Low Intermediate High
Lymphoma subtype
DLBCL
BL
PBL
ARL, not further classifiable Median follow up (years)
(n=254)
44
230 (91%) 19031
74 (30%) 248
213 (90%) 47 (20%) 17 (8%)
100 (42%) 104 (44%) 34 (14%)
127 (50%) 91 (36%) 29 (11%) 7 (3%) 4.64
(n=21)
48
20 (95%) 26790
5 (24%) 190
20 (95%) 7 (33%) 2 (10%)
5 (24%) 11 (52%) 5 (24%)
7 (33%) 11 (52%) 3 (14%) 0 (0%) 5.4
45
357 (92%) 18557
112 (30%) 212
312 (87%) 85 (23%) 36 (11%)
122 (36%) 168 (46%) 74 (20%)
189 (49%) 133 (34%) 54 (14%) 11 (3%) 2.4
BL: Burkitt lymphoma; DLBCL: diffuse large B-cell lymphoma; PBL: plasmablastic lymphoma; IPI: International Prognostic Index; BM: bone marrow; CNS: central nervous sys- tem. aTwo-sided Pearson’s χ2. bKruskal-Wallis test.
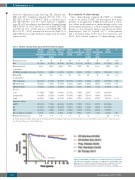
Figure 2. Kaplan-Meier estimates for overall survival (OS) of the differ- ent observed treatment outcomes of aggressive non-Hodgkin lym- phomas. CR: complete remission; Prog. Disease: progressive disease; Part. Remission: partial remission. Dotted line indicates 3 months.
860
haematologica | 2018; 103(5)
