
Page 122 - Haematologica-5
P. 122
854
R. Bomben et al.
was considered as BCRlow according to GEP data. Also in the context of LN samples, no correlation was found between the different biological parameters and BCR groups (data not shown).
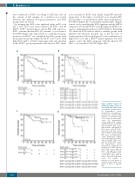
By merging the MCL cases analyzed either in PB or in LN, a total of 83 cases were collected, 43 BCRlow and 40 BCRhigh. BCRhigh patients had a shorter PFS with respect to BCRlow patients (median PFS: 42.1 months vs. not reached; P=0.0074) (Figure 4A). Since Ki-67 is a well-known prog- nosticator in MCL,26 we combined the BCR groups with the prognostic groups defined by Ki-67 score. Cases with high Ki-67 (≥30% of Ki-67 expressing cells) and classified in the BCRhigh group experienced the shortest PFS, while
cases classified as BCRlow had similar longer PFS intervals irrespective of the high or low Ki-67 score (median PFS: 20.5 months vs. not reached for all the other combinations; P=0.0014) (Figure 4B). Consistently, multivariable analysis carried out by including the BCR signature and the MIPI-c categories selected the BCRhigh and the high risk MIPI-c cat- egory as independent predictors of PFS (Table 2). Regarding OS, while the BCR readout failed to identify groups with different OS intervals, possibly due to the low rate of events and short follow up (Figure 4C), the combination of high Ki-67 score and a BCRhigh 6-gene signature was able again to select the MCL subgroup with the shortest OS (46.7 vs. not reached; P=0.029) (Figure 4D).
A
B
C
D
Figure 4. BCRhigh mantle cell lymphoma (MCL) group is associated with a worse clini- cal outcome (overall series). (A) Kaplan-Meier curves obtained by comparing pro- gression-free survival (PFS) intervals of 43 BCRlow MCL cases with 40 BCRhigh MCL cases. (B) Kaplan-Meier curves obtained by compar- ing PFS intervals of 19 BCRlow and low Ki-67 MCL cases, with 20 BCRlow and high Ki-67 MCL cases, with 21 BCRhigh and Ki-67 low MCL cases, with 10 BCRhigh and Ki-67 high MCL cases. (C) Kaplan-Meier curves obtained by compar- ing overall survival (OS) inter- vals of 43 BCRlow MCL cases with 40 BCRhigh MCL cases. (D) Kaplan-Meier curves obtained by comparing OS intervals of 19 BCRlow and low Ki-67 MCL cases, with 20 BCRlow and high Ki-67 MCL cases, with 21 BCRhigh and Ki- 67 low MCL cases, with 10 BCRhigh and Ki-67 high MCL
cases. The number patients in each group is reported under relative cate- gories; P refers to log-rank test.
of
haematologica | 2018; 103(5)
