
Page 66 - Haematologica-April 2018
P. 66
R. Le Calloch et al.
the dose of interferon: treatment non-adherent patients had higher doses (81.5 versus 46.5 mg/week, P=0.05).
Organizing pills according to intake schedules (drug diary) or having someone to remind the patients when to take their drug did not improve adherence. For both groups, having experienced thrombosis or phenotypic evolution did not modify the adherence to treatment. In the subpopulation of patients treated for ET, no significant association was found between non-adherence and thrombotic events, whether for cytoreductive therapy (ORR=1.25; 95% CI: 0.55–2.83) or for antithrombotic drugs (ORR=1.3; 95% CI: 0.45-3.72). This was also true for patients with PV (ORR=1.36; 95% CI: 0.65-2.82 and ORR=1.72; CI: 0.6-4.94, respectively) (Online Supplementary Figure S2).
Reasons for treatment non-adherence
To gain further insight into the causes of non-adherence to treatment, patients were asked to identify the most important reasons why they had skipped doses.
The two most frequent reasons were simply forgetful-
ness and difficulties in managing their treatment during holidays and travel (62% and 55%, respectively). Interestingly, the former was more frequently claimed by group 1 (48%) while the latter was the most frequent rea- son in group 2 (40%). In group 2, professional schedule constraints were also frequently brought up (26%). Some patients expressed more than one reason.
It is interesting to note that 12% of patients reported voluntarily omitting some treatment and that no patients mentioned side effects as a cause of non-adherence. All the reasons are presented in Figure 1.
It is also interesting that 20/55 (40.8%) of the patients who did not adhere fully to their treatment believed that forgetting their treatment on occasions had no influence on its efficacy, and only four of them increased the dose following a missed intake.
Incidence of thrombotic events and hematologic evolu- tions after completion of the questionnaire
To determine whether non-adherence to treatment had an impact on the evolution of the MPN, as has been
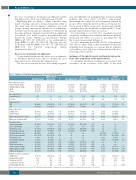
Table 2. Analyses of treatment non-adherence in the studied population. Whole cohort
Group 1 Non-adherent pts Adherent pts P
55 (23.6) 178 (76.4) 33 (15.2) 200 (84.8) 21 (9) 212 (91) 67 (28.8) 166 (71.2)
66.6 73.4 0.0013 0.96 0.65 0.2
27 (49.1) 101 (56.7) 0.52 28 (50.9) 77 (43.3)
23 (41.8) 53 (29.8) 0.1 28 (50.9) 100 (56.2) 0.35
14 (25.5) 34 (19.2) 0.31 4 (7.3) 24 (13.6) 0.34
Treatment (n/%)
Hydroxycarbamide
Doses (pills/wk)
Duration (>1 y)
Second-line therapy
Pegylated interferon
Doses(injections/wk)
Duration(>1y) 9(90) 40(93) 1 na na
Group 2 Adherent pts P
43 (81.1) 40 (72.9) 48 (90.6) 35 (66)
56.8 0.31 0.72 0.16
17 (39.5) 0.5 26 (60.5)
11 (25.6) 1 21 (48.8) 1
11 (25.6) 0.4 6 (13.9) 0.35
na na na na
10 (18.9) 1 46.5 (26.1) 0.05 40(93) 1 35 (81.4) 0.2
na
na
28 (65.1) 0.17 28 (66.6) 0.84 29 (67.4) 0.46
34 (79.1) 0.33 13.5 0.98 252 0.08
5.7 1 3.1 0.74
Non-adherence (n/%) Cytoreductive drugs Antithrombotic drugs Both
Total
Age at the time of
consultation (y)
Sex ratio
Pathology (n/%) ET
PV
Style of life (n/%) Living alone
City resident
History of thrombosis (n/%)
History of evolution (n/%)
Non-adherent pts
65 (22.7) 46 (16.1) 26 (9.1) 85 (29.7)
68.1 1.1
32 (49.2)
33 (50.8)
25 (38.5) 33 (50.8)
18 (27.7) 7 (10.8)
Adherent pts P 221 (77.3)
240 (83.9) 260 (90.9) 201 (70.3)
70.7 0.007 0.66 0.07
118 (53.4) 0.55
103 (46.6)
64 (29) 0.15 121 (54.8) 0.12
45 (20.4) 0.21 30 (13.6) 0.55
Non-adherent pts
10 (18.9) 13 (27.1) 5 (9.4) 18 (34)
61.1 2.33
5 (50)
5 (50)
2 (20) 5 (50)
4 (40) 3 (30)
na
na
na
na
42 (79.2) 81.5 (53.1) 9(90)
6 (60) na na 4 (40) 8 (80) 5 (50)
5 (50) 13.9 379 5.7 3.5
41 (74.6) 12.3
50 (90.9) 21 (38.2) 42 (79.2) 81.5 (53.1)
121 (68.6) 0.31 10.1 0.11 158 (89.3) 0.73 67 (37.8) 0.97
41 (74.6) 121 (68.6) 0.31 12.3 10.1 0.11 50 (90.9) 158 (89.3) 0.73 21 (38.2) 67 (37.8) 0.97
10 (18.9) 1 46.5 (26.1) 0.05
na na na na
Second-line therapy Drug diary
Help to remember Same timing of intake Own timing for intake Other medications
Full blood counts at inclusion CHR (n/%)
Hemoglobin (g/dL) Platelets (x109/L) Leukocytes (x109/L) Neutrophils (x109/L)
6 (60) 13 (24.1) 9 (16.4) 42 (64.6) 36 (55.4) 44 (67.7)
33 (50.8) 13.6 355 6.15
4
35 (81.4) 0.2 54 (30.5) 0.36 19 (10.7) 0.26 185 (83.7) 0.0008 77 (34.8) 0.003 175 (79.2) 0.05
144 (65.2) 0.03 13.3 0.21 319 0.11
6.4 0.26
4.2 0.17
na na
13 (24.1) 54 (30.5) 0.36
9 (16.4) 19 (10.7) 0.26 38 (69.1) 157 (89.2) 0.0003 28 (52.8) 59 (33.7) 0.03 39 (70.9) 146 (82.5) 0.06
28 (50.9) 110 (61.8) 0.3 12.4 12.1 0.18 354 339 0.51 7.81 7.12 0.51 7.28 5.11 0.45
CHR: complete hematological response; ET: essential thrombocythemia; n: number; PV: polycythemia vera; pts: patients; wk: week; y: years; %: percent.
610
haematologica | 2018; 103(4)
