
Page 175 - Haematologica-April 2018
P. 175
Tocilizumab for the prevention of acute GvHD
transplants never dropped their platelet count below 20,000. In these patients, the date of platelet recovery was defined as the first day that the platelet count increased after its nadir. The grade of aGvHD was determined using the Glucksberg scale.21 cGvHD was graded using the National Institutes of Health (NIH) Chronic GvHD Consensus criteria.22
Statistical analysis
The probabilities of DFS, aGvHD-free survival, and OS were calculated using the Kaplan-Meier estimator. The probabilities of neutrophil and platelet engraftment, TRM, disease progression/relapse, and aGvHD and cGvHD were calculated
using the cumulative incidence estimator. GvHD was calculated using disease progression/relapse or death as competing risks. Matching criteria for controls consisted of age within 5 years; per- formance score (≥90 vs. <90); Bu-based regimen (Flu/Bu reduced intensity, Bu/Cy MA, or Flu/Bu MA); disease, and donor type (human leukocyte antigen [HLA]-matched sibling vs. HLA- matched unrelated donor). Up to four matches per case were selected whenever possible; when more controls were available preference was given to identical stem cell source (bone marrow, peripheral blood) and closest age. With respect to stem cell source, 124 of the 135 CIBMTR control patients were also matched for this variable. The follow up of the control patients was adminis- tratively censored at 22 months, which corresponded to the longest follow up of the trial patients. With 35 patients enrolled in the trial and 140 controls, there was an 80% power to detect an improvement of 20% on day 180 aGvHD-free survival. The out- comes were compared between groups using a stratified log-rank test or Gray’s test for survival and competing risk outcomes, respectively, with matched sets defining strata. Stratified Cox or Fine-Gray regression was used to obtain hazard ratios with 95% confidence intervals. Each cytokine was analyzed separately in the combined sample, and by conditioning regimen (ablative vs. RIC). Cytokine values were shifted by half of the smallest non- zero value and then log-transformed to improve normality of the residuals. First, a separate analysis was conducted for each treat- ment group (Toc and Control) followed by a joint analysis. A repeated measures analysis was performed using a mixed effects model with a random subject-specific intercept to incorporate within-subject dependence. All time-points were compared to the baseline value with Dunnett-Hsu adjustment for multiple testing. The estimates were back-transformed to the original scale for reporting.
Other detailed methods
Serum cytokine and immune reconstitution analyses are described in Online Supplementary Methods.
Results
Patient characteristics
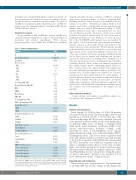
From January 29, 2015 to June 30, 2016, 35 patients were enrolled in the study. The demographic data for this population is detailed in Table 1. The median age of the cohort was 66 (range: 22-76). Diseases consisted of de novo acute myeloid leukemia (AML; n=14), acute lymphoblas- tic leukemia (ALL; n=4), secondary or therapy-related AML (n=5), myelodysplastic syndrome (MDS; n=3), chronic myelomonocytic leukemia (CMML; n=5), myelofibrosis (n=1), T-cell lymphoma (n=1), chronic myeloid leukemia (CML; n=1), and natural killer (NK)/T- cell lymphoma (n=1). The disease status of patients with acute and chronic leukemia are further specified in Table 1. Four of the 14 patients with AML in first remission had FLT3/ITD mutations, two additional recipients had evi- dence of minimal residual disease at the time of trans- plant, and another patient had a monosomal karyotype. All three patients with ALL in complete remission 1 (CR1) were Philadelphia chromosome positive. Using the adjust- ed disease risk index,23 patients were classified as low (n=4), intermediate (n=22), or high (n=9) risk.
Engraftment and chimerism
There were no cases of graft rejection. The median time to an ANC>500 was 18 days (range: 14-26) (Figure 1A).
Table 1. Patient characteristics. Variable
Value
N 35
Age, median (range)
Sex (M/F) Disease (n, %)
AML CR1 CR2
ALL CR1
CR2
Secondary AML, CR1 Therapy-Related AML, CR1 MDS
CMML
Myelofibrosis
CML, CP2
T-cell Lymphoma, CR2 NK/T-cell Lymphoma, CR2 Donor Type (n, %)
MRD
MUD
Preparative Regimen (n, %)
Bu/Cy Flu/Bu4 Flu/Bu2
Graft Source (n, %)
Bone Marrow
Peripheral Blood Disease Risk Index (n, %)
Low Intermediate High
CMV Serostatus (n, %)
Donor−/Recipient− Donor+/Recipient− Donor+/Recipient+ Donor−/Recipient+
66 (22-76) 22/13
14 (40) 11
3
4 (11) 3
1
3 (9) 2 (6) 3 (9) 5 (14) 1 (3) 1 (3) 1 (3) 1 (3)
14 (40)
21 (60)
5 (14) 13 (34) 7 (51)
6 (17)
29 (83)
4 (11) 22 (63) 9 (26)
12 (34) 11 (31) 4 (11) 8 (23)
AML: acute myelogenous leukemia; ALL: acute lymphoblastic leukemia; MDS: myelodysplasia; CMML: chronic myelomonocytic leukemia; CML: chronic myeloge- nous leukemia; MRD: matched related donor; MUD: matched unrelated donor; CMV: cytomegalovirus;Bu:busulfan;Cy: cyclophosphamide;Flu:fludarabine;CR:complete remission; CP2: second chronic phase.
haematologica | 2018; 103(4)
719
