
Page 124 - Haematologica-April 2018
P. 124
A. Arvidsson et al. Results
MCL cells adhere stably to stromal cells
Approximately 10% of MCL cells (Jeko-1), which nor- mally grow in suspension, adhered to a mono-layer of the bone marrow-derived, adherent stromal cell line (MS-5) upon co-culture and remained in place when MCL cells remaining in suspension were poured away after 24 h (Figure 1A). The interaction with stromal cells was stable because addition of a 10-fold excess of CFDA-SE labeled MCL cells to the stromal cells with adhered MCL cells and
incubation for a further 24 h did not significantly displace the unlabeled bound cells (Figure 1A). Interestingly, the labeled MCL cells were able to bind to stromal cells inde- pendently of the previously bound MCL cells. Similar results were obtained when the order of addition of labeled and unlabeled cells was reversed (Figure 1A), indi- cating that the CFDA-SE label does not significantly affect the adherence characteristics of Jeko-1 cells in this assay. Thus, the co-cultured MCL cells could be divided into two relatively stable subsets (adherent and suspension), and therefore it was of interest to characterize differences in
A
B
CD
E
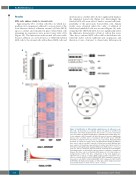
Figure 1. Identification of differentially regulated genes in adherent co-cul- ture cells. (A) A fraction of co-cultured Jeko-1 cells adhere to an MS-5 cell mono-layer and remain stably bound in the presence of excess suspension cells. The number of unlabeled (light gray) or CFDA-SE labeled (dark gray) Jeko- 1 cells adhered to MS-5 stromal cells after 24 hours (h) was not significantly reduced after a further 24 h of incubation (48 h) with excess CFDA-SE (P=0.841) or unlabeled (P=0.391) Jeko-1 cells, respectively. Mean±Standard Deviation are shown for cultures (n=3). (B) Experimental design showing the three Jeko-1 and the two MS-5 stromal cell fractions for which RNAseq data were acquired. (C) Heatmap representation of relative transcript levels for the 3697 genes with significantly changed mRNA levels (FDR q-value ≤ 0.05) in at least one Jeko-1 cell fraction after hierarchical clustering. (D) Venn diagram illustrating number of differentially expressed genes in pair-wise comparisons between the three Jeko-1 cell fractions (FDR q-value ≤ 0.05, total number of changed genes: 3697). The three comparisons in the Venn diagram are: adherent Jeko-1 cells in co-culture (ADH) compared with suspension Jeko-1 cells in co-culture (SUSP), n=1050 (ADH/SUSP), ADH compared to mono-cul- tured Jeko-1 cells (SEP), n=3453 (ADH/SEP) SUSP compared to SEP n=1471 (SUSP/SEP). (E) Ranked fold changes of 1050 genes with changed transcript levels in ADH relative to SUSP Jeko-1 cells in co-culture.
668
haematologica | 2018; 103(4)
