
Page 92 - Haematologica3
P. 92
452
N. Landberg et al.
direct assay, we measured CD36 expression in BM cells from three CML patients treated for three months with imatinib, bosutinib or dasatinib, respectively. All three sam- ples showed a substantial reduction of CD36 expression in the CD34+CD38low compartment as compared to matched diagnostic samples (Figure 4A). To assess the BCR/ABL1 sta-
tus of the cells during treatment, only patient #11 treated with imatinib had a sufficient number of cells to allow for FACS sorting and subsequent FISH analyses. The CD34+CD38lowCD36+ cells contained 44% BCR/ABL1 posi- tive cells, whereas CD34+CD38lowCD36- cells only con- tained 6% BCR/ABL1 positive cells (Figure 4B,C). This
ABC
DEF
GH
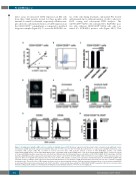
Figure 3. A subgroup of primitive CML cells less sensitive to imatinib express CD36 (A) Linear regression and Spearman’s rank correlation show significant correla- tion between IL1RAP and CD36 expression in primitive CML cells, Y=0.76X + 2.4; r=0.68, P=0.0048. (B) Contour plot of co-expression of IL1RAP and CD36 in a rep- resentative CML sample (CML #5). (C) FISH on sorted cells from three CML patients showed a mean of 98% BCR/ABL1 positive cells within CD34+CD38lowIL1RAP+CD36+ cells and 98% BCR/ABL1 positive cells within CD34+CD38lowIL1RAP+CD36– cells. In the CD34+CD38lowIL1RAP–CD36– cell fraction a mean of 3% were BCR/ABL1 positive; mean based on cells from two CML patients, the third patient had no cells with a CD34+CD38lowIL1RAP–CD36– phenotype. (D) FISH showing a BCR/ABL1 positive (upper panel) and negative (lower panel) cell. (E) CD34+CD38lowIL1RAP+ CML cells FACS sorted according to CD36 expression does not appear to differ in cell growth and survival in vitro. The mean of three CML samples is shown; error bars depict standard deviation. (F) CD34+CD38lowIL1RAP+ CML cells FACS sorted according to CD36 expression and treated with imatinib at a concentration of 5μM show that CD36 expressing cells are more resistant to imatinib treatment in vitro. The mean of three CML samples is shown; error bars depict standard deviation. (G) Representative histograms from cell cycle analysis using DRAQ5 to determine DNA content show a majority of both CD36+ and CD36– cells in G0/G1 phase within the CD34+CD38lowIL1RAP+ population. (H) Data on cell cycle status from three CML patient samples are summarized showing mean and standard deviation. *P<0.05. ns; not significant.
haematologica | 2018; 103(3)
