
Page 48 - Haematologica3
P. 48
X. Fang et al.
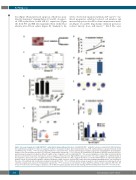
bers (Figure 1B) and increased apoptosis, which was quan- tified by Annexin V staining (Figure 1C and D). As expect- ed, KO erythroblasts lacked miR-451 expression (Figure 1E). Both WT and KO cells maintained their erythroblast identity after 48 h in culture (Figure 1F). Similarly to the
effects observed in expansion medium, miR-144/451−/− ery- throid progenitors exhibited reduced cell numbers and increased apoptosis after 48 h culture in maturation medi- um (Figure 1G and H). Importantly, erythroid precursors isolated directly from miR-144/451−/− E14.5 FLs were
AB
C
E
D
F
H
J
G
I
408
Figure 1. Increased apoptosis of miR-144/451−/− erythroblasts during erythropoietic stress. (A) miR-144/451−/− progenitor cells were isolated from E14.5 fetal liver (FL) erythroblasts and grown in culture in expansion medium or maturation medium. (B) Cell proliferation rates of FL erythroid blasts in expansion medium for 24 and 48 hours (h). n=3 FLs. **P<0.01 (t-test). Experiments were repeated 3 times. (C) Flow cytometry-based analysis of apoptosis using Annexin V. (D) Quantitative analysis of the flow cytometry data from (C). Data from 3 independent experiments. **P<0.01 (t-test). (E) Quantitative PCR analysis of miR-451 expression in FL pro- genitors grown in expansion medium for different lengths of time. Progenitor cells from miR-144/451−/− FLs, mouse B-lymphoma cell line 38B9, and normal B lym- phocytes sorted from mouse bone marrow were used as negative controls. Note: the high miR-451 expression in the 0-h culture suggests the erythroid identity of the progenitors, whereas the lack of a significant increase in miR-451 after 48 h in culture suggests that there is no further differentiation of erythroid progenitors grown in culture. (F) FL progenitors grown in expansion medium for 48 h. Cells were cytospun onto slides and stained with May-Grunwald-Giemsa. (G) Cell prolifera- tion rates of FL erythroid cells in maturation medium for 24 and 48 h. N=3. **P<0.01 (t-test). (H) Percentage of apoptotic cells in maturation medium based on flow cytometric analysis. Data represent 3 independent experiments. **P<0.01 (t-test). (I) Cell numbers in whole E14.5 FLs without in vitro expansion. WT n=10, KO n=11. *P<0.05 (t-test). (J) Percentage of apoptotic cells in different regions gated by CD71/Ter119 staining and FSC intensity. WT n=7, KO n=6. *P<0.05 (t-test).
haematologica | 2018; 103(3)
