
Page 174 - Haematologica3
P. 174
534
J. Pidala et al.
Statistical analysis
The primary end point of the study was the peripheral blood mean Treg/total CD4+ ratio at day 30 following HCT. The expect- ed Treg/total CD4+ was 19% at 30 days among SIR/TAC/placebo patients based on observed data in SIR/TAC-treated patients in a previous trial.18 With 15 patients per study arm, standard deviation of 11, and type I error of 0.05, the study had 80% power to detect an increase in Treg/total CD4+ to 31% among ustekinumab-treat- ed patients using a two-sided Mann-Whitney test.
Baseline characteristics were summarized using descriptive sta- tistics including mean, median, standard deviation and range for continuous measures and counts, and frequencies for categorical measures. Comparisons between study arms were made by the Cochran-Mantel-Haenszel test for categorical measures and by the two-way analysis of variance (ANOVA) or the Friedman two- way ANOVA for continuous measures including biological correl- ative data and Quality of Life over the study period, adjusting for the stratification variable donor type: matched sibling versus
matched unrelated donor. The difference in cumulative incidence of grade II-IV acute GvHD was estimated using the stratified Gray test.19 Survival data were analyzed using the Kaplan-Meier method, and stratified comparisons used the log-rank test.
Results
Patients’ characteristics
Randomization resulted in a balanced distribution of patients', disease, and HCT variables (Table 1). Included patients were adults with an anticipated representation of hematologic malignancies. No significant differences were observed between groups for the studied variables.
Pharmacokinetic and pharmacodynamic studies
The mean serum concentration-time plots for ustek- inumab are shown in Figure 1A. Sustained levels of ustek-
A
B
P ≤ 0.0001
P = 0.11
P = 0.28
P = 0.0009
P = 0.4
P = 0.18
P = 0.37
P = 0.08
P = 0.38
P = 0.029
P = 0.03
C
P = 0.015
P = 0.09
P = 0.02
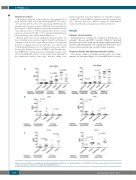
Figure 2. Donor responder cell cytokine production after stimulation with host or 3rd-party stimulators. *IFN-γ ELISPOT and supernatant cytokines (IL-4, IL-17) shown as in (A), (B) and (C). P-values for comparison by Mann-Whitney test.
haematologica | 2018; 103(3)
