
Page 157 - Haematologica3
P. 157
Melphalan dose pre-transplant in MM
planted in very good partial response/complete response (adjusted HR 1.19).
The cumulative incidence of relapse at 3 years was not significantly different between the Mel140 (55.1%; 95 % CI: 48.6-61.6) and Mel200 (59.9%; 95% CI: 57.5-62.3) groups (Figure 3A). The adjusted HR for relapse was 0.99 (95% CI: 0.78-1.25; P=0.935) for Mel140 (Figure 3B). Subgroup analysis again showed a significant interaction of melphalan dose with disease status at the time of ASCT (P=0.07), in that transplantation in partial response or less significantly favored Mel200 (adjusted HR 0.56 for Mel200 versus Mel140). The adjusted HR for transplantation in partial response was 0.98 while that for transplantation in very good partial response/com- plete response was 1.2.
Patients with high-risk chromosomal abnormalities had poorer overall and progression-free survival, and a higher cumulative incidence of relapse, compared with those with other chromosomal aberrations, but we observed no statistically significant differences between Mel140 and Mel200 in high-risk or standard-risk patients (Figure 4). Similarly, while ISS stage was associated with overall and
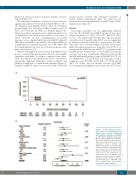
A
progression-free survival, and cumulative incidence of relapse (Online Supplementary Figure S1), there was no interaction between melphalan dose and ISS stage (Online Supplementary Figure S2).
Toxicity
Non-relapse mortality was not significantly different between the Mel140 and Mel200 groups [1-year non- relapse mortality 1.3% (95% CI: 0.0-2.7) and 0.9% (95% CI: 0.4 – 1.3), respectively; P=0.20]. The early non-relapse mortality rate at 3 months after ASCT was not significant- ly different either (0.8 and 0.5%, respectively; P=0.198). The main cause of death within 12 months of the trans- plant was relapse/progression, being the cause in 77.8% of patients in the Mel140 group and 80.0% of patients in the Mel200 group. Median times to neutrophil and platelet recovery were not significantly different between the Mel140 and Mel200 groups, being 12 (Mel140 95% CI: 12- 13; Mel200 95% CI: 12-12) days in both groups for neu- trophil recovery (P=0.283) and 16 (95% CI: 15-17) and 15 (95% CI: 15-16) days for platelet recovery (P=0.468). Second primary malignancy rates 5 years after ASCT were
B
Figure 1. Overall survival after autolo- gous stem cell transplantation for patients who received conditioning with melphalan 140 mg/m2 (Mel140) or 200 mg/m2 (Mel200). (A) Kaplan- Meier curves. (B) Multivariate analyses. The overall hazard ratio and correspon- ding P value (bottom line) refers to the comparison between Mel140 and Mel200 performed in a Cox model with- out interactions; the other hazard ratios and P values refer to interaction terms between melphalan dose and the indi- cated factors. All comparisons are adjusted for: age at transplant, renal function, prior proteasome inhibitor treatment, gender, status of disease, and Karnofsky score. CR/VGPR: com- plete response/very good partial response; PR: partial response.
haematologica | 2018; 103(3)
517
