
Page 168 - 2020_08-Haematologica-web
P. 168
C. Damm-Welk et al.
54.1°C after optimization. A serial limited 10-fold dilution of the ALK-positive cell line Karpas 299 in peripheral blood mononuclear cells from 10-1 to 10-5 was performed to evaluate the sensitivity and specificity of the dPCR assay (Table 2). Normalized copies of NPM-ALK were detected in cDNA prepared from dilutions of 10 ALK-pos- itive cells in 1,000,000 normal cells in one out of four repli- cates. The peripheral blood mononuclear cells used for dilution had no detectable copies of NPM-ALK.
To estimate the rate of false positivity, blood from 20 healthy controls and BM or blood from eight ALK-nega- tive ALCL patients was analyzed. No positive droplets were detected in BM or blood from ALK-negative ALCL patients or 20 healthy controls. All samples were nega- tive by RQ-PCR. Since higher copy numbers of NPM- ALK were measured by dPCR compared to RQ-PCR, the cut-off for outcome analysis was set at 30 NCN for the dPCR.
Comparison of NPM-ALK quantification by digital and quantitative real-time polymerase chain reaction analyses in bone marrow and blood samples
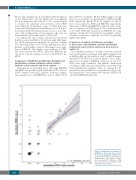
Measurement of circulating tumor cells using RQ-PCR and dPCR was possible in 132 initial BM (n=75) or blood (n=57) samples from ALCL patients. Forty-five samples were negative by both RQ-PCR as well as dPCR (31/75
BM, 14/57 blood samples). Of the 75 BM samples, 19 and 15 were low positive, not quantifiable by dPCR and RQ- PCR, respectively. Of the 57 blood samples, 21 and 14 were low positive by dPCR and RQ-PCR, respectively. The results of dPCR and RQ-PCR correlated with a corre- lation coefficient of r=0.85 (Figure 3). Above the threshold of 10 NCN NPM-ALK measured by RQ-PCR the copy numbers obtained by both methods were highly correlat- ed with a correlation coefficient of r=0.96, but generally higher with dPCR.
Comparison of patient stratification according
to the results of quantitative real-time and droplet polymerase chain reaction analyses in bone marrow and blood
The cumulative incidence of relapse, event-free survival and overall survival of patients with dPCR quantification of MDD in BM (n=75) and blood (n=57) by dPCR using a threshold of 30 NCN are shown in Figure 4. The compa- rable data according to RQ-PCR, using the cut-off of 10 NCN, were almost identical. The patients’ distribution according to MDD measured in BM was concordant with both quantification methods (Table 3). Among the 57 patients for whom MDD was quantified in blood, only one patient had a discordant result with ≤30 (dPCR) but >10 NCN (RQ-PCR) (Table 3b).
Figure 1. Normalized copy numbers of NPM-ALK in blood and bone marrow measured by quantitative real-time poly- merase chain reaction. Copy numbers of NPM/ALK/104 copy numbers of ABL1 were measured in 70 patients in initial blood and bone marrow samples. PCR: polymerase chain reaction.
2144
haematologica | 2020; 105(8)
