
Page 147 - 2020_08-Haematologica-web
P. 147
EVI1 triggers metabolic reprogramming
AB
C
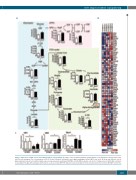
Figure 3. Expression of EVI1 is associated with metabolic reprograming. (A) “Map” of the metabolic pathways and metabolite concentrations in the glycolysis, PPP, and TCA cycle pathways. The concentrations of F1,6P, lactate, fumarate, and malate were significantly higher in Evi1/MF9 cells (n=3). (B) Heat map of genes encod- ing metabolism-related factors differentially expressed upon genomic profiling of WT/MF9 or Evi1/MF9 leukemia cells (n=3). (C) Expression of Idh1, Idh2, and Glut- 1 operating in the glycolytic pathways and TCA cycle, as measured by qRT-PCR. Expression was normalized to that of b-actin and to that of whole WT/MF9 cells (n=4).
haematologica | 2020; 105(8)
2123
