
Page 144 - 2020_08-Haematologica-web
P. 144
Y. Saito et al.
AB
CDE
FG
HI
L
JK
M
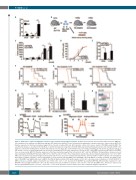
Figure 1. EVI1 induces aggressive MLL-AF9 leukemia cells to activate mitochondrial respiration. (A) Evi1 expression was detected in the LSK fraction, the GMP frac- tion, and whole bone marrow cells (BM) from wild-type (WT) (white bar) and Evi1-TG mice (black bar) by quantitative real-time polymerase chain reaction (qRT-PCR). Relative expression of Evi1 was normalized against that of b-actin on whole BM cells. (B) Schematic outline of the mouse model of WT/MF9 and Evi1/MF9. The experimental details are described in the Methods. (C and D) Hematopoietic progenitors from WT (white bar) and Evi1-TG (black bar) mice infected with an MF9 retro- virus were cultured in methylcellulose medium and replated every five days. The colony numbers for each round of replating are indicated in (C). The percentage of GFP-positive cells for each replating round is presented as a line graph (D). (E) Relative expression of Evi1 in the GFP+ and L-GMP fractions from WT/MF9 or Evi1/MF9 mice, as measured by qRT-PCR. Relative expression of Evi1 was normalized against that of β-actin on GFP+ cells from WT/MA9. (F) Kaplan-Meier survival curves of mice transplanted with MLL-AF9-transduced WT (n=6) or Evi1-TG cells (n=6 mice; three independent experiments). (G) Secondary transplantation of 104 or 103 GFP+ AML cells revealed increased leukemogenesis by Evi1-TG cells (n=5–10 mice; three independent experiments). (H) Total number of GFP+ leukemia cells in peripheral blood from secondary recipients. (I and J) Total number of acute myeloid leukemia (AML) cells and L-GMP cells in the BM of secondary recipients. Secondary recipi- ents of Evi1/MF9 had significantly more L-GMP in the BM. (K) Representative FACS profiles (gated on lin-c-kit+ cells) show reduced numbers of CD34+CD16/32+ L- GMP (red box). (L and M). Oxygen consumption rate (OCR) of the c-kit+ or c-kit- fractions from WT/MF9 (L) and Evi1/MF9 (M). Mitochondrial respiration in c-kit+ WT/MF9 cells was higher than that in c-kit– cells. By contrast, there was no difference between c-kit+ and c-kit– cells from Evi1/MF9 mice. All data are expressed as the mean±standard deviation. *P<0.05; **P<0.005; ***P<0.0005 (Student’s t-test). Survival curves were compared using the log-rank test.
2120
haematologica | 2020; 105(8)
