
Page 238 - 2020_07-Haematologica-web
P. 238
O. Penack et al.
AB
≤ 4.3 mg/dL
> 4.3 mg/dL
Strata
≤ 4.3 mg/dL > 4.3 mg/dL
≤ 4.3 mg/dL
> 4.3 mg/dL
Strata
≤ 4.3 mg/dL
> 4.3 mg/dL
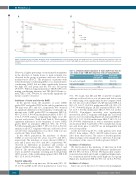
Figure 1. Survival at one year after allogeneic stem cell transplantation. Overall survival (OS) (A) and progression free survival (PFS) (B) after allogeneic stem cell transplantation (alloSCT) in cohorts according to uric acid serum levels prior to alloSCT: with high uric acid serum levels (blue line), patients with low uric acid levels (red line).
However, a higher percentage of sex mismatch transplants in the direction of female donor to male recipient was observed in the group of patients with uric acid above median before alloSCT. The frequency of patients with reduced-intensity conditioning (RIC) versus myeloablative conditioning (MAC) did not differ significantly between the high uric acid group and the low uric acid group (P=0.077). When looking exclusively at TBI (P=0.59) or by mixing conditioning intensity and TBI (MAC/Chemo vs. MAC/TBI vs. RIC: P=0.20), no statistically significant dif- ference could be observed.
Incidence of acute and chronic GvHD
In the present study, the incidence of acute GvHD grades II-IV and grades III-IV in the whole population at 100 days were 25% and 11%, respectively. We observed no significant differences in the frequency of clinically sig- nificant acute GvHD grades II-IV in univariate (HR 1.2, 95% CI: 0.8-1.9, P=0.4) and multivariate (HR 1.5, 95% CI: 1.0-2.4, P=0.08) analysis comparing the high- versus the low uric acid cohorts. (Table 2 and Table 3). We found no significant differences in the frequency of acute GvHD grades III-IV in univariate (HR=1.8, 95% CI: 0.9-3.4, P=0.08) and multivariate (HR 1.7, 95% CI: 0.9-3.2, P=0.11) analysis in alloSCT recipients with uric acid levels above cut-off before transplantation versus those with low uric acid levels (Table 2 and Table 3).
In the whole population, the incidence of chronic GvHD at one year and two years was 27% and 40%, respectively. The incidence of severe chronic GvHD at 1 year and 2 years was 18% and 24%, respectively. We observed no differences in incidence and severity of chronic GvHD between the two cohorts (Table 3 and Table 4). The chronic GvHD incidence was significantly lower in alloSCT recipients receiving anti-T-cell globulin (ATG) as part of the conditioning regimen (ATG, HR 0.25 95% CI: 0.13-0.5, P<0.0001).
Survival endpoints
The median follow-up time was 15.2 months (95% CI: 13.1-17.0) and OS in the whole population at 1 year was
Table 2. Univariate global comparison of acute graft-versus-host dis- ease shown at day +100 after allogeneic stem cell transplantation.
Group
Uric acid </=4.3 mg/dL
Uric acid >4.3 mg/dL
P-value
GvHD: graft-versus-host disease; CI: confidence interval.
Acute GvHD II-IV (95% CI)
22% (17-29)
26% (20-33)
Acute GvHD III-IV (95% CI)
8% (5-13)
14% (9-19)
0.08
0.39
74%. We found, that OS and PFS of alloSCT recipients with uric acid levels above cut-off, measured before start of conditioning, were significantly shorter compared with the low uric acid cohort (Figure 1A, OS univariate HR 2.4, 95% CI: 1.6-3.7, P<0.001; multivariate HR 2.8, 95% CI: 1.7-4.7, P<0.0001) (Figure 1B, PFS univariate HR 2.0, 95% CI: 1.1-3.7, P=0.02; multivariate HR 2.7, 95% CI: 1.4-5.0, P=0.003). Non-relapse mortality was significantly increased in alloSCT recipients with high uric acid levels prior to start of conditioning (Figure 2A, univariate HR 2.0, 95% CI: 1.1-3.7, P=0.02; multivariate HR 2.7, 95% CI: 1.4- 5.0, P=0.003). Multivariate as well as univariate analyses are shown in Table 3 and Table 4. We conclude that serum uric acid levels prior to alloSCT are an independent risk factor for mortality.
At the last follow-up 29.3% of the patients were dead (49.6% from relapse, 45.2% alloSCT-related causes and 2.6% from other causes). The causes of death in patients without relapse were mainly due to infection. A descrip- tive analysis of the causes of death is given in Table 5.
Incidence of infections
We first looked at the incidence of infections in both cohorts and found no significant differences (multivariate HR 0.8, 95% CI: 0.6-1.1, P=0.4). We than looked at infec- tion-related mortality and found a significant higher num- ber of infection-related deaths in the high uric acid group (Figure 2C, multivariate HR 2.6, 95% CI: 1.2-5.2, P=0.01).
Incidence of relapse
Since uric acid is known to be released from malignant
1980
haematologica | 2020; 105(7)
OS
OS
PFS
PFS
