
Page 223 - 2020_07-Haematologica-web
P. 223
FGG rs2066865 and the risk of cancer-related VTE
the entire case-cohort and in those with active cancer dur- ing follow-up are presented in Table 1. Subjects who developed active cancer were slightly older (61±10 years vs. 58±13 years) and reported a higher frequency of daily smoking (46% vs. 35%) compared to the entire case- cohort. The minor allele frequency of rs2066865 was 0.26, which is comparable to reference populations.14,29 The homozygous variant of the FGG was present in 289 (6.6%) subjects, the heterozygous variant in 1,723 (39.4%) subjects, while 2,362 (54.0%) subjects were non-carriers of the FGG variant. The allele frequency was essentially similar in subjects who developed cancer. Expected versus observed proportions of hetero- and homozygous individ- uals in the subcohort according to the Hardy-Weinberg equilibrium are presented in Online Supplementary Table S1.
The clinical characteristics of the VTE events stratified by the presence of active cancer are shown in Table 2. Compared to the non-cancer-related VTE, cancer-related VTE were more often a DVT (59.2% vs. 55.5%) than a PE (40.7% vs. 44.4%). The prevalence of provoking factors such as acute medical conditions, immobilization and sur- gery were essentially similar between the two groups, as were the total proportion of VTE with one or more con- current provoking factors (44.3% vs. 44.7%). Non-cancer related VTE were more likely to be associated with trau- mas (9.6% vs. 2.4%) while other provoking factors (i.e. venous catheters) were more frequent in cancer-related VTE (8.4% vs. 3.7%).
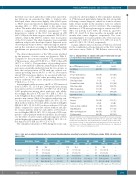
In participants without cancer, the IR of VTE increased from 1.2 (95% CI: 1.1-1.4) per 1,000 people/year among non-carriers of FGG rs2066865 to 2.0 (95% CI: 1.5-2.7) per 1,000 people/year among those with two risk alleles. Accordingly, the risk of VTE was 70% (HR 1.7, 95% CI: 1.2-2.3) higher in those with two risk alleles at FGG com- pared to non-carriers (Table 3). In subjects with active can- cer, the risk was 12-fold higher (HR 11.9, 95% CI: 9.3- 15.2) in those with no FGG risk alleles, and 22-fold higher (HR 22.2, 95% CI: 12.9-38.1) in those with two FGG risk alleles, compared to cancer-free subject without risk alle- les. Cancer patients with two risk alleles at FGG had a two-fold higher (HR 2.0, 95% CI 1.1-3.6) risk of VTE com- pared to cancer patients without risk alleles. In sub-analy- ses, the effect of active cancer and homozygosity at FGG yielded higher risk estimates for PE (HR 2.9, 95% CI: 1.3- 6.6) than for DVT (HR 1.6, 95% CI: 0.7-3.5).
The cumulative incidence of VTE during the active can-
cer period is shown in Figure 2. The cumulative incidence of VTE increased particularly during the first six months following a cancer diagnosis, where we found a substan- tially steeper incline in the incidence curve for subjects with two risk alleles at FGG rs2066865. The cumulative incidence of VTE among homozygous carriers was 5.0% (95% CI: 2.4-9.6), 6.4% (95% CI: 3.5-11.6), and 8.0% (95% CI: 4.6-13.9) at three months, six months and 24 months after cancer diagnosis, respectively. The corre- sponding figures for cancer patients who were non-carri- ers were 2.1% (95% CI: 1.5-3.0), 3.1% (95% CI: 2.3-4.7), and 4.8% (95% CI: 3.8-6.2), respectively.
A supra-additive effect on the risk of VTE was observed for the combination of homozygosity at the FGG variant and active cancer (Table 4). The Relative excess risk by
Table 2. Characteristics of subjects with cancer-related and non-can- cer-related first venous thromboembolism.
Table 3. Age and sex adjusted hazard ratios for venous thromboembolism according to categories of fibrinogen gamma (FGG) risk alleles and cancer status.
Age at VTE diagnosis (years)
Sex (Males) VTE type
Deep vein thrombosis Proximal upper limb Distal upper limb Proximal lower limb Distal lower limb Other localizations Pulmonary embolism
Unprovoked event Provoking factors
Surgerya
Traumaa
Acute medical conditionb Immobilizationc
Other provoking factord Total provokede
Yes (167)
69 ±11
44.9 (75)
59.2 (99) 5.1 (5) 1.0 (1) 62.6 (62) 12.1 (12) 19.1 (19) 40.7 (68) NA
12.6 (21) 2.4 (4) 15.0 (25) 20.4 (34) 8.4 (14) 44.3 (74)
No (459)
68±14
47.3(217)
55.5 (255) 2.0 (5) 0 (0) 65.9 (168) 28.2 (72) 3.9 (10) 44.4 (204) 54.9 (252)
15.3 (70) 9.6 (44) 14.2 (65) 20.0 (92) 3.7 (17) 44.7 (205)
Cancer-related VTE
Values are numbers or percentages with numbers in parenthesis or means ± standard deviation (SD); VTE: venous thromboembolism; NA: not applicable; awithin eight weeks before the VTE-event; bmyocardial infarction, ischemic stroke of major infec- tious disease; cbedrest >3 days, wheelchair, long haul travel >4 hours in the past 14 days; dpresence of other provoking factors noted by the physician (e.g. intravenous catheters); eone or more provoking factor above
No cancer
Active cancer
1 170 2 47 0 89 1 64
2 14
1.0 (0.8-1.2)
1.7 (1.2-2.3)
11.9 (9.3-15.2)
12.2 (9.2-16.1)
22.2 (12.9-38.1)
- 70
0.9 (0.6-1.2)
1.7 (1.1-2.7)
8.3 (5.6-12.5)
10.6 (7.1-16.3)
22.8 (10.6-49.1)
- 100
1.1 (0.8-1.4)
1.6 (1.1-2.5)
15.3 (11.2-21.1)
13.4 (9.2-19.6)
21.6 (10.0-46.4)
VTE Risk Alleles Events HR
(95% CI)
0 242 Ref.
HR (95% CI)
Events
PE
HR (95% CI)
HR (95% CI)
Events
DVT HR (95% CI)
HR (95% CI)
-
-
-
Ref.
1.0 (0.6-1.5) 1.6 (0.7-3.5)
- 112 Ref.
- 130 Ref.
- 22 Ref. 32 1.1 (0.8-1.5) 29
- 25 Ref. 57 1.3 (0.8-2.2) 35
2.0 (1.1-3.6) 7
2.9 (1.3-6.6) 7
Active cancer: period from six months before a cancer diagnosis until two years after; CI: confidence interval; DVT: deep vein thrombosis; HR: hazard ratio; PE: pulmonary embolism;VTE: venous thromboembolism.
haematologica | 2020; 105(7)
1965
