
Page 139 - 2020_07-Haematologica-web
P. 139
Bortezomib combined with pediatric AML chemotherapy
non-fatal treatment-related toxicities. Therefore, institu- tions were notified on this date that patients receiving protocol therapy on the bortezomib arm should switch to the standard chemotherapy arm immediately. There were 22 patients who were receiving protocol therapy on the bortezomib arm at this time.
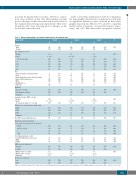
Table 1. Patient demographics and clinical characteristics by treatment arm.
Table 1 and Online Supplementary Table S1 summarizes the demographic characteristics of patients by study arm; no significant differences were observed in these dem- graphic characteristics. Of note, 33% and 13% of patients had favorable cytogenetic or molecular features, respec- tively, and <5% had unfavorable cytogenetic features.
Characteristic
Gender Male
Female
Age at diagnosis, years
Overall N%N%N%
P
0.773
Arm A Arm B
572 52% 525 48%
285 53% 257 47%
287 52% 268 48%
Median
Range 0-29.5 0.03-29.5 0-29.2
9.2
237 22% 372 34% 273 25% 188 17% 27 2%
125
199 19% 863 81%
9.5
107 20% 130 23% 189 35% 183 33% 139 26% 134 24% 91 17% 97 17% 16 3% 11 2%
3 1% 6 1% 24 5% 27 6% 3 1% 5 1% 69 14% 67 14% 384 80% 383 78% 1 0% 0 0% 1 0%
9.1 0.511
0-1 [0-730 day old] 2-10
11-15
16-20
0.139 0.507 0.565 0.763 0.300
0.506 0.699 0.726 0.793 0.652 1.000
0.945
0.185 0.620
0.617 0.507 0.905
0.720
0.725 0.883 0.545 0.814
0.805 0.558 0.364
0.929
0.247
0.664
≥21
Race
American Indian or Alaskan Native
Asian
Native Hawaiian or other Pacific Islander Black or African American
White
Multiple Races
Unknown
Ethnicity
Hispanic or Latino Not Hispanic or Latino Unknown
9 1% 51 5% 8 1% 136 14% 767 79%
35 Median 17.7
59 66
99 19% 100 19% 427 81% 436 81%
16 19
17 19.2 0.6 - 2730 0.6 - 2600
85 16% 93 17%
358 70% 372 69% 100 20% 115 21% 53 10% 55 10%
31 13
82 15% 88 16%
84 16% 82 15% 57 11% 57 11% 9 2% 12 2% 6 1% 7 1%
37 7% 40 7% 37 7% 43 8% 29 5% 37 7%
386 75% 396 75%
128 25% 133 25%
2.8 1.9 0.1 - 93 0.1 - 92 28 26
417 79% 419 78%
111 21% 119 22%
Leukemic burden, WBC, x 109/μL Range
0.6 - 2730
178 16%
730 69% 215 20% 108 10%
44
170 15%
166 20% 114 13% 21 3% 13 1%
77 7% 80 7% 66 6%
782 75%
261 25%
2.3 0.1 - 93 54
836 78%
230 22%
N. of patients with >100 x 109/μL
CNS disease classification at study entry
CNS1 CNS2 CNS3 Unknown
Non-CNS extramedullary disease
Risk factors and classification Cytogenetics affecting risk classification
t(8;21)
Inv(16), t(16;16) -7
-5/5q-
Institution mutation results
Low FLT3-ITD allelic ratio (≤0.4) NPM
CEBPα
MRD at end of induction I
Negative
Positive
MRD positive %, median MRD positive %, range Unknown
Risk group assignment Low
High
AML: acute myeloid leukemia; CNS: central nervous system; ITD high AR: internal tandem duplication with high allelic ratio; MRD: minimum residual disease; WBC: white blood cell count.
haematologica | 2020; 105(7)
1881
