
Page 86 - Haematologica - Vol. 105 n. 6 - June 2020
P. 86
N. Maslah et al.
Treatment with the APR + AZA combination is characterized by a specific gene expression profile
We conducted a transcriptomic analysis of the SKM1 cell line following treatment with APR, AZA, or a combi- nation of these two drugs. A large number of genes were differentially expressed (P<0.05) under treatment by AZA on its own or by APR + AZA (n=4,620 and n=4,672, respectively), while the number of genes differentially expressed under APR alone was relatively small (n= 691) (Figure 6A). Accordingly, the number of genes deregulated in common for APR and APR + AZA treatments was small (n=201) while this was very high for the AZA and the APR + AZA treatments (n= 3,461). As expected, the Gene Set Enrichment Analysis (GSEA) (Figure 6B) and DAVID analyses of the genes differentially expressed by APR identified the p53 pathway as one of the main deregulated pathways [Normalized Enrichment Score (NES) = 1.2; false discovery rate (FDR) = 0.15], with increased expres- sion of p53-target genes such as CDKN1A, CASP1, BAX, and FAS. These differential expression patterns were con- firmed by real-time quantitative polymerase chain reac- tion (RT-qPCR) analysis (Figure 6D). In accordance with the involvement of some of these genes in apoptosis, the GSEA analysis also revealed activation of an early apop- totic program (NES= 1.1; FDR= 0.2) (Figure 6B). Importantly, similar results on p53 and pro-apoptotic pathways were found to occur when AZA was added to APR (Figure 6C and E), thus suggesting that AZA did not suppress the transcriptional modifications associated with APR treatment. Of note, enrichment of ROS-induced genes was found to occur with APR on its own (FDR= 0.06; NES= 1.2) (Online Supplementary Figure S6A) and APR + AZA (FDR= 0.02; NES= 1.52) (Online Supplementary Figure S6B), possibly confirming a p53-independent mech- anism of action of APR on oxidative stress, as has already
been described in other tumor models.27,34,35 Using Interpretative Phenomenological Analysis (IPA) analysis and a selection of genes with a significant level of differ- ential expression (P<0.05) (Online Supplementary Table S2) on the basis of the difference in fold change (FC), we found 5,428 transcriptionally-regulated genes with APR + AZA treatment compared to untreated cells. Eight hun- dred and seventy-five genes appeared to be up- or down- regulated with the combined treatment only (“synergistic only” genes) and not by either drug on their own. GSEA analysis of the "synergistic only" genes revealed activation of the p53 pathway, induction of an apoptotic program, and downregulation of the MYC pathway (Online Supplementary Table S3). Surprisingly, in this group of "syn- ergistic only" genes, we identified decreased expression of several FLT3-pathway genes, including FLT3 and FLT3-L (Online Supplementary Table S2). This finding was con- firmed using the comparative GSEA analysis, which simi- larly revealed downregulation of the FLT3 pathway (Valk, FLT3-ITD representative of activation of the FLT3 path- way) (Figure 7A) with the combination treatment com- pared to either of the drugs on their own. Using RT-qPCR, we were able to confirm the significant downregulation of both the FLT3 and the FLT3-L gene with the combined treatment (Figure 7B).
Downregulation of the FLT3 pathway contributes to the APR + AZA-induced anti-proliferative effect
To analyze the relevance of downregulation of the FLT3 signaling pathway to the synergistic effect of the APR + AZA combination, SKM1 cells were cultured with these drugs in the presence or absence of FLT3-L at different concentrations. The addition of FLT3-L on its own did not affect SKM1 cell proliferation, but, when increasing amounts of FLT3-L were added to the APR + AZA combi-
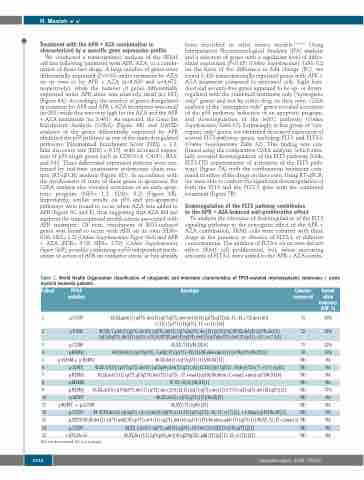
Table 1. World Health Organization classification of cytogenetic and molecular characteristics of TP53-mutated myelodysplastic syndromes / acute myeloid leukemia patients.
Patient
1
2
TP53
mutation
p.V157F
p.P190L
Karyotype
45,XX,add(1)(q4?3),del(5)(q1?3q3?3),der(6)t(6;14)(p2?2;q1?2)x2,-11,-14,+?15,der(16)t (?;16)(?;p1?1)[11q13?],-17,+r(11)[24]
45,XX,-7,add(3)(p2?6),del(4)(q2?4),del(5)(q1?q3q3?3),del(12)(p13)[10]/47,XX,del(4)(q2?4),del(5)
(q1?q3q3?3),del(12)(p13),+21[6]/47,XX,del(4)(q2?4),del(5)(q1?q3q3?3),del(12)(p13),+21,+r(?)[4] 45,XX,-7[4]/46,XX[6] 44,XY,del(5)(q1?3q3?3),-7,add(17)(p1?1),-19[11]/44,idem,del(11)(p1?4p1?5)/46,XY[3] 46,XX,del(5)(q1?3q3?3)[11]/46,XX[13] 45,XX,t(4;13)(p1?3;q1?2),del(5)(q15q34),del(7)(q21),dic(12;16)(p11;?p1?2),-18,der(?21)(?),+r(?)[cp21] 46,XX,ins(3;12)(p2?1;q13q2?4),del(12)(q1?3),-17,+mar1[cp10]/46,idem,-7,+mar2,+min[cp7]/46,XX[6] 47,XY,+8[21]/46,XY[1] 43,XX,del(5)(q1?4q3?3),del(7)(q?21),der(12)t(12;13)(p1?1;q1?3),der(13)t(7;13)(q21;q13),del(18(q21)[21] 46,XX,del(5)(q1?3q3?3)[15]/46,XX[7]
Colonies Variant sequenced allele
frequency (VAF, %)
71 90%
72 92%
71 22% 50 30% ND NA
ND NA ND NA ND NA ND 77% ND NA ND NA ND 9% ND NA ND NA ND NA
3
4
5
6 p.S241C 7 p.R248Q 8 p.M246R 9 p.R248Q 10 p.A276T
p.C238F
p.R248Q p.V216M + p.R248Q
11
12 p.C275Y 44-47,XY,del(5)(q13q33),+8,+9,del(9)(q2?2),t(12;15)(p13;q1?2),-13,-17,+r(?)[3], +1-4mar[cp19]/46,XY[3]
13
14
15
p.R273C46,XY,del(2)(q1?1),add(10)(p1?1),de1(11)(q2?1),del(16)(p1?1)[19]/46,idem,add(17)(q2?5)[3]/46,XY,-12,-17,+2mar[3]
p.C238Y 44,XX,-5,del(7)(q2?1),add(8)(q2?4),-18,?der(21)t(8;21)(q?13;q2?1)[21]
c.675-2A>G 45,XY,der(1;5)(q10;p10),del(4)(q2?4q?21),add(17)(p1?1),-21,+r(?1)[21]
p.R248T + p.L330R 46,XY,i(17)(q10)[25]
ND: not determined; NA: not available.
1544
haematologica | 2020; 105(6)
